

Introduction
Over the last decade, a big stride was made in research on neurocritical care, which translated into better outcomes for patients treated in the neurointensive care unit (NeuroICU).1 The main purpose of the NeuroICU is to treat patients with severe brain injuries, such as large ischemic or hemorrhagic stroke, traumatic brain injury (TBI), or status epilepticus. Patients with such injuries develop neurologic damage when the initial injury develops (primary brain injury [PBI]). However, a significant portion of patients develop secondary deterioration while being treated in the NeuroICU, which is termed as secondary brain injury (SBI). Even with severe tissue destruction, some viable tissue still exists in the surrounding area of the PBI and may be more vulnerable to additional damage, which is often triggered by the PBI itself as well as by systemic deterioration. Traditionally, PBI was considered to be an irreversible process. On the other hand, SBI is, at least, partially reversible and preventable if identified early and treated appropriately. Therefore, current neurocritical care aims for early detection and minimization of SBI before it becomes irreversible.2,3
The common SBIs are brain tissue hypoperfusion or ischemia due to intracranial pressure (ICP) surges, brain tissue hypoxia (BTH), brain tissue hypoglycemia, or excitotoxic damage due to recurrent seizures. Even though SBI is frequently encountered in the NeuroICU, neurological examination alone is not sensitive enough for monitoring on-going SBI because such patients are usually comatose.4 Moreover, when the neurological examination shows worsening, it is usually too late to adequately treat, and permanent damage has already occurred.
Considering that patients in the NeuroICU are vulnerable to SBI, more sensitive and accurate methods are required to detect secondary neurophysiologic deterioration as early as possible. Direct monitoring of physiological parameters is technically possible and would expand the monitoring capabilities across patients with various neurologic injuries. A comprehensive understanding of various physiological parameters will allow medical practitioners to pursue a multifaceted approach to limit the occurrence of SBI, which is currently possible with the help of multimodality monitoring (MMM). MMM gathers a variety of information including ICP, cerebral blood flow (CBF), real time brain metabolism of glucose and oxygen, and the electrical status of the brain, all of which allow for a better understanding of any physiological changes in the brain. A list of currently available MMM techniques are described in Table 1. The majority of clinical outcome studies using MMM have focused on TBI and subarachnoid hemorrhage (SAH). Currently, MMM is expanding its coverage to other neurologic conditions such as severe ischemic stroke or intracerebral hemorrhage (ICH).5-9
Here, we briefly review the basic concepts of MMM as a neurophysiologic monitoring tool as well as its clinical applicability in patients with severe stroke.
Location of monitoring
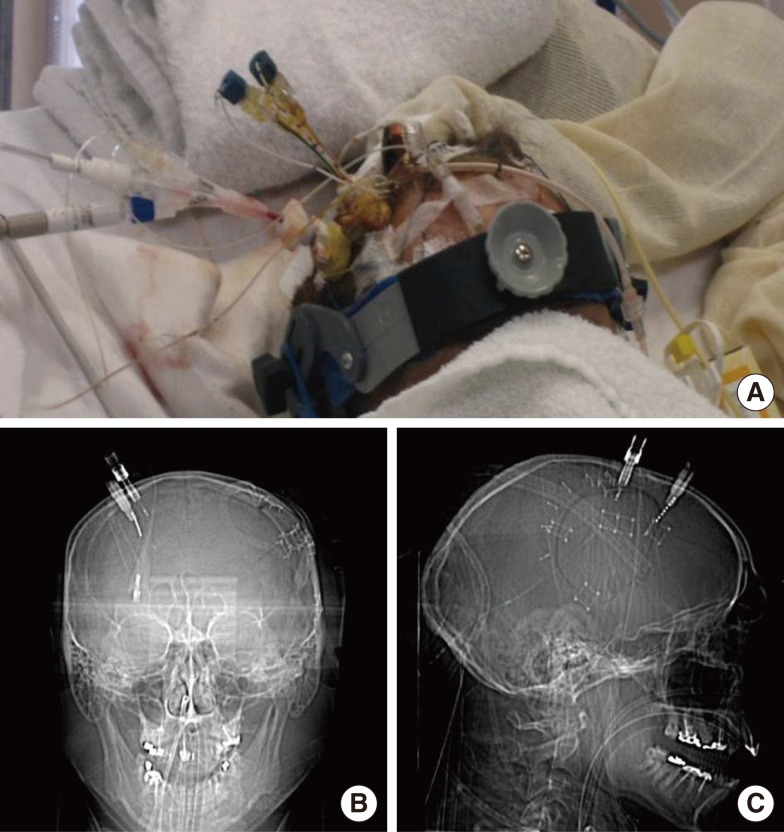
Currently, the most accurate method for neuromonitoring is direct tissue monitoring. Although various forms of non-invasive monitors have been developed, their accuracy is still far from satisfactory. For direct monitoring, MMM probes are inserted into the brain parenchymal tissue via a burr hole and are fixed to the skull using a cranial bolt system (Figure 1). The diameter of the probe is usually less than a few millimeters, regardless of the form of the monitor. Given the fact that the information only represents a small sampling area (from a few mm3 to cm3), proper probe location is very important in interpreting physiologic data.
The ideal location for MMM tissue probes is still unknown. However, the consensus is to monitor those brain tissues that are at the highest risk of secondary damage. In cases of focal brain injury, such as ICH or large cerebral infarction, the ideal location of monitoring is the perihematomal area or ischemic penumbra, respectively. Therefore, probes are inserted into the perilesional frontal white matter.10 In cases with bilateral pathology, such as diffuse TBI or SAH due to anterior communicating artery aneurysm rupture, non-dominant frontal white matter is generally chosen as the probe location. However, when ipsilateral damage is very severe and the patient has already undergone a hemicraniectomy, the probes cannot be affixed to the ipsilateral skull. In this situation, the monitors are inserted into the contralateral areas in close proximity to the PBI. Complications due to probe placement are reported to be as low as 1-2%.10 The majority of complications are procedure-related hemorrhage, proberelated infection, or misplacement of the probe in the core of the PBI. Hemorrhagic complication risk stemming from MMM probe placement is reported to be similar to that stemming from extraventricular drain (EVD) insertion. Most reported cases with probe-related infection had concomitant EVD, and infection is ascribed to be associated with EVD insertion, rather than direct infection via burr-hole procedure. Currently, the MMM probe is inserted visually while targeting the perilesional tissue. However, more studies are needed to clarify the best location for monitoring.
Intracranial pressure
Regardless of the fact that the primary mechanisms are cytotoxic or vasogenic, patients with severe strokes usually develop severe brain edema, which leads to an elevation in ICP. If intraventricular hemorrhage and/or hydrocephalus are present in combination, the chances of elevated ICP are even higher.
ICP monitoring is the most crucial step in the understanding of cerebral hemodynamics. Because ICP is regarded as a form of resistance in terms of cerebral perfusion, cerebral perfusion pressure (CPP), a difference between mean arterial pressure (MAP) and ICP, is considered as a net driving force for cerebral perfusion. A major adverse consequence of pathologic ICP elevation is cerebral hypoperfusion, leading to secondary brain ischemia. Global tissue perfusion and CBF are associated with CPP, thus, CPP is regarded as an indicator of CBF.
It is possible to reliably measure the ICP via a ventricular catheter or intraparenchymal fiberoptic system; however, the gold standard for measuring the ICP is through EVD. The pressure measured by EVD represents global ICP levels, since EVD measures intraventricular pressure. Any pressure generated by a focal mass may be transmitted to the lateral ventricle until equilibrium is reached. Meanwhile, more direct parenchymal ICP systems became available; a good example is the Camino fiberoptic ICP monitor (Integra Lifesciences). Because ICP can frequently be compartmentalized in cases of focal injury, local ICP surrounding the primary lesion may more accurately reflect the changes of cerebral hemodynamics than ICP at remote areas. Therefore, focal ICP measurement may be more suitable for cases with focal brain mass.
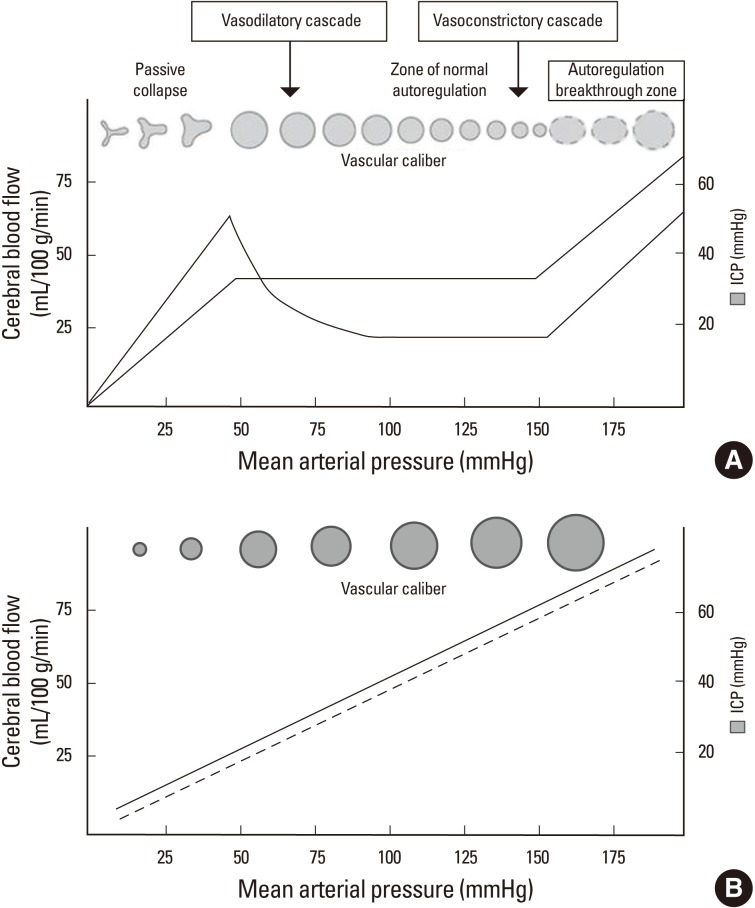
The normal range of ICP is between 5-15 mmHg. According to the Monro-Kellie doctrine, the total intracranial volume is fixed. If an increase in parenchymal volume is not compensated by a reduction in the cerebrospinal fluid volume or cerebral blood volume, an elevation in ICP ultimately ensues.11 With ICP surges, abnormal clinical features develop, such as the Cushing reflex (high blood pressure with decreased heart rate) or pupillary dilatation without light reflex. However, by the time clinical signs of ICP elevation are evident, it is usually too late to intervene and reverse the process. Therefore, for cases in which an elevation in ICP is suspected, the American Stroke Association (ASA) ischemic stroke and ICH guidelines recommend ICP monitoring.12,13 The ICP pressure-volume curve depicts ICP starts skyrocketing when its value goes higher than 20 mmHg, suggesting a fatigue point of compensation (Figure 2). Therefore, traditional ICP-guided therapy aims to keep the ICP below 20 mmHg. However, a recent randomized clinical trial failed to show the superiority of the ICP number-oriented therapy compared to the conventional image-based ICP treatment.14 Although ICP elevation in TBI is somewhat different in pathophysiology from that in stroke, studies suggest that more complex strategies are needed in treating patients with ICP elevation, rather than simply modulating ICP numbers. In the ASA guidelines, most ICP management strategies are based on studies on TBI. Regardless of the underlying physiologic differences in ICP elevation, maintaining proper CPP before initiating ICP lowering treatments is of utmost importance. With respect to CPP, the ASA ICH guidelines suggest that CPP be maintained at least at 60 mmHg.13 Without ICP monitoring, information on ICP and CPP cannot be obtained, limiting the optimal management of patients with large ICH.
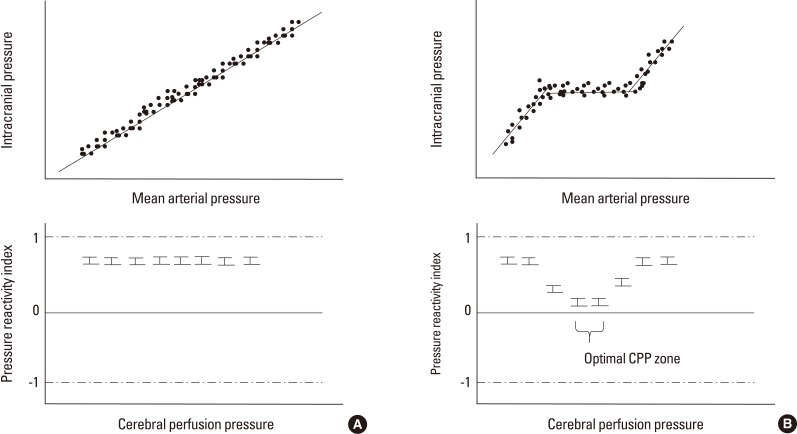
Another benefit of ICP monitoring is that it provides some information on the status of cerebral autoregulation (AR). Under ideal conditions, in order to determine whether AR is intact, we need to have information on CPP as well as CBF. By definition, when CBF is stably maintained within a certain CPP range, the patient is said to have intact AR. However, direct CBF measurement is not always feasible, except in cases for which concomitant Hemedex monitoring is used. With the simple correlation between ICP and MAP, more practically, we can determine whether AR is intact or not. Theoretically, if the AR is intact, cerebral resistance vessels start to constrict in order to maintain constant CBF as CPP increases. Meanwhile, in cases with AR failure, cerebral blood vessels are just passively dependent on CPP or MAP, and the ICP/MAP relationship is linear (Figure 3). However, this static correlation between MAP and ICP is somewhat arbitrary, and a more objective and continuous method is needed for the real time assessment of the AR status. Continuous assessment of AR is possible by the moving correlation coefficient between ICP and MAP over 200-300 seconds using a 5-second interval data set.15 This Pearson's correlation coefficient is called a pressure reactivity index (PRx), which is a real time surrogate marker for pressure AR. A PRx smaller than 0.2 is generally considered as a sign of intact AR, while a PRx greater than 0.2 suggests AR failure.15
Using PRx values, optimal CPP targets can be identified for individual patients, and this aids in creating an individualized goal-directed therapy. Mean PRx-CPP plots show a U-shaped curve in the majority of patients with brain injury. Hence, CPP ranges with the lowest mean PRx values reveal ideal and optimal CPPs where AR is most actively working (Figure 4). This concept was validated in patients with TBI and SAH.16 In a small group of comatose patients with ICH, survivors were maintained at slightly higher ranges of CPP compared to optimal CPP ranges, while the non-survivors had values in the lower ranges of CPP compared to the optimal CPP.8 Moreover, and especially in patients with ICH, the AR status is regarded as an independent predictor of mortality.8
In patients with malignant middle cerebral artery infarction, the majority of the ipsilateral hemisphere is already infarcted; hence, it is difficult to find a proper location for monitoring. These patients are often candidates for decompressive hemicraniectomy. Therefore, an ICP monitor is inserted in the contralateral hemisphere where the skull is intact, but this provides a falsely low ICP value compared to the perilesional ICP. Herniation and pupillary dilatation may occur without ICP surges in the contralateral hemisphere.17 More studies are needed regarding ICP monitoring in patients with large ischemic stroke.
Although there are different ICP monitoring methods, including subdural techniques, they are not commonly used in clinical practice due to accuracy issues. In addition, non-invasive ICP monitoring is still not accurate enough for routine clinical use.
Brain tissue oxygen
Since cerebral ischemia is the most common form of SBI, early detection of BTH is one of the most important purposes of neuromonitoring. Catheter probes, which can sense partial pressure of oxygen at the tissue level, were introduced into the clinical practice more than a decade ago. Two types of oxygen sensors were introduced: one uses a Clark-type electrode (Licox, Integra Lifesciences), and the other uses fluorescent optical sensors (Neurotrend) which is no longer available.18
In vitro studies have shown that the Licox probe has adequate data accuracy and stability for clinical use, and has been used for brain oxygen monitoring in the NeuroICU. Like other tissue monitors, Licox is a focal monitor with a probe diameter of 0.5 mm and a measurement volume of 7-15 mm3. For stable oxygen measurement, Licox needs to run for a few hours after insertion. Therefore, in clinical practice, the low brain tissue oxygen tension (PbtO2) level that occurs right after probe insertion does not necessarily indicate that the probe is in the infarcted area, since some time is needed for the probe to display a valid value. Because gaseous pressure is temperature dependent, the measured oxygen tension should be adjusted for the tissue temperature. The machine automatically performs temperature adjustments if the brain temperature probe is simultaneously inserted; otherwise, manual temperature correction is warranted. Cerebral oxygen tension is generally driven by CBF and the local oxygen extraction fraction. Therefore, measured PbtO2 can be used as a rough indicator of the CBF in metabolically stable conditions when the oxygen extraction fraction is stable.19
PbtO2 levels in the white matter of a healthy individual are around 25-30 mmHg, which is quite lower than expected.20 While searching for clinically meaningful low cut-off values for predicting poor outcomes, several studies have demonstrated that a PbtO2 measurement of less than 10 mmHg is associated with a decrease in oxygen extraction, suggestive of a poor functional status.21 Moreover, the duration of time when PbtO2 is lesser than 20 mmHg is associated with poor outcomes in SAH and TBI.22 Although it is difficult to pinpoint the clinically critical hypoxic point, a PbtO2 level below 15-20 mmHg is generally regarded as a threshold value for BTH. The Brain Trauma Foundation guidelines suggest that PbtO2 be maintained at more than 15 mmHg.23
Since PbtO2 level is influenced by many physiologic variables, critically low PbtO2 levels can be improved by adjusting certain physiological factors.19 A recent study showed that the main factors affecting PbtO2 are the CBF and partial pressure of oxygen in the arterial blood (PaO2). In terms of oxygen delivery, the vast majority of oxygen is transferred as a hemoglobin (Hb) bound form. Because the Hb-carried oxygen level is 450 times more than dissolved-oxygen levels in the blood, the unbound form is usually neglected when calculating oxygen transport. However, Hb-bound oxygen cannot directly increase tissue oxygen tension; it needs to be dissociated from Hb at the tissue level. Therefore, in patients with low PbtO2, several therapeutic approaches can be used to increase PbtO2. An increase in fraction of inspired oxygen (FiO2) level is the simplest way to increase PaO2 but it can mask the underlying cause of the low PbtO2 and is generally discouraged. In the NeuroICU, CBF augmentation is often achieved by increasing CPP (by adding more vasopressors) or decreasing ICP (using ICP lowering therapies). When the cardiac output is low, inotropes such as Dobutamine or Milrinone are used for augmenting CBF. In cases with severe ICP crisis due to large hemispheric infarction, decompressive hemicraniectomy immediately improves PbtO2 levels, most likely by decreasing ICP and increasing CPP.24
By defining BTH as a PbtO2 level of less than 15 mmHg, we can identify a CPP threshold below which the chances of BTH dramatically increase in comatose patients with ICH.8 This is important for managing such patients if they are in facilities without sophisticated brain tissue oxygen monitoring. In general, blood pressure is usually lowered to limit hematoma expansion in patients with acute ICH based on the result of a randomized clinical trial.25 However, the patients in that trial were mostly non-comatose; therefore, the results cannot be directly translated to patients with ICH who are comatose. Moreover, it is unclear whether keeping the blood pressure low is still beneficial after the first 24 hours when the critical period for hematoma expansion has already passed. A recent study demonstrated that concomitant ischemic infarcts were more frequently found when the blood pressure was abruptly and drastically lowered. Although it is still speculative, uniformly maintaining low blood pressure over several days may not be safe in patients with ICH who are under coma. More studies are needed to confirm this. In Korea, the Licox monitor is currently under safety investigation at Korean Food and Drug Administration as of March 2013.
Global measurement of cerebral oxygenation: Jugular bulb oxygen saturation
In addition to Licox, a focal tissue oxygen monitor, there is another type of global brain oxygen monitoring system.26,27 Oxygen levels in the cerebral venous outflow may inversely correlate with global brain oxygen consumption. Therefore, oxygen saturation in the jugular bulb (SjVO2) may be used to indirectly estimate cerebral oxygen consumption. It is still unclear whether the right or ipsilateral jugular vein should be monitored. The majority of patients have right side dominance in their internal jugular venous drainage, thus monitoring oxygen saturation in the dominant draining vein may be reasonable. Most experts choose the dominant right side because they think that this jugular vein more accurately represents global oxygen consumption regardless of the location of the lesion.26 There is another non-invasive oxygen monitoring technique that uses infrared technology (near infrared spectroscopy). However, its clinical implication remains to be elucidated in patients with stroke.28
Cerebral blood flow monitoring
CBF measurement provides a better understand of the perfusion status of brain. Transcranial Doppler or laser Doppler flowmetry can measure blood flow velocity, which is just an surrogate of CBF. Computed tomography or magnetic resonance perfusion can measure regional CBF but these yield qualitative data and only represent the time at which the scan was performed. An accurate quantitative measurement is possible using positron emission tomography, single-photon emission computed tomography, or xenon computed tomography. However, these techniques only provide a snapshot of the perfusion status of brain, and a more continuous measurement of CBF is mandatory in the NeuroICU. A prototype of continuous CBF monitoring is the Hemedex Bowman Perfusion Monitor System (Cambridge, MA).29 The probe has 2 thermistors, one of which is heated to 2Ōäā higher than the measured brain temperature. Because the probe temperature is higher than the body temperature, if blood flow exists near the probe, relatively colder blood comes in and a change in the heat energy field develops.30 The thermal diffusion probe senses the difference between thermal energy fields and back calculates the actual CBF using a thermal energy transfer equation.29,31 The time resolution for the CBF measurement is 1 Hz, which is an ample resolution time for examining autoregulation (Figure 5). Another benefit of this monitor is that it can measure the thermal conductivity of brain tissue as it calibrates at user-defined intervals. Measured thermal conductivity can then be transformed into water content using a simple conversion equation. Therefore, the Hemedex monitor can be utilized to estimate real-time brain water content, which can be used as an indicator of brain edema around the probe.32
Continuous CBF measurement could be useful in patients with large ischemic stroke. Progression of the infarction is associated with gradual CBF reduction. The role of Hemedex as a trend monitor was validated in patients with SAH and progressing vasospasm.33 More studies to determine whether Hemedex is useful in detecting deteriorating hemodynamic status in patients having large ischemic stroke are needed. In Korea, Hemedex has been approved by the KFDA and is ready to use.
Microdialysis: Real time metabolic monitoring
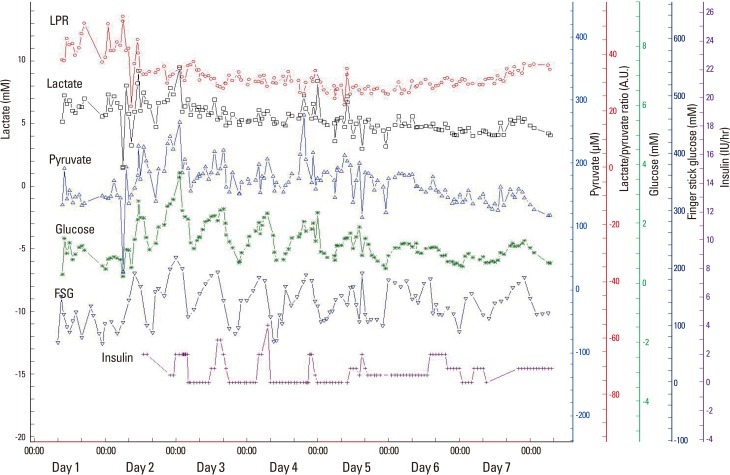
Continuous monitoring of tissue metabolism is possible using cerebral microdialysis. Microdialysis infuses lactate-free artificial cerebrospinal fluid (molecular concentration of: Na+ 148 mmol/L, Ca2+ 1.2 mmol/L, Mg2+ 0.9 mmol/L, K+ 2.7 mmol/L, Cl- 155 mmol/L) at a rate of 0.3 ┬ĄL/min through a sterile infusion pump system.34 The molecules in the interstitial fluid then move across the microdialysis membrane and into the infusion fluid, where they reach equilibrium. Theoretically, any molecule can be measured depending on the pore size of the membrane. However, glucose, lactate, pyruvate, glutamate, and glycerol are most frequently measured in clinical settings.34 Glucose, lactate, and pyruvate are 3 key molecules in the glycolysis pathway; therefore, the changes in the concentration in these molecules are used to identify a shift in the glycolysis pathway. In patients under sedation, the average concentrations of glucose, lactate, and pyruvate are reported to be 1.7 mM, 2 mM, and 120 ┬ĄM, respectively.34,35 Under normal conditions, glucose is converted to pyruvate after several steps, and then the NAD/NADH ratio determines whether it enters into the citric acid cycle or is transformed into lactate. Under anaerobic conditions, more lactate is produced, so the lactate/pyruvate ratio (LPR) surges. Under aerobic conditions, the average LPR value is around 15. However, when the patient is under metabolic distress, the LPR value starts to increase. A LPR value greater than 25 is considered as an early sign of metabolic distress, while a LPR less than 40 is associated with ongoing cell energy dysfunction and cellular metabolic crisis.36,37
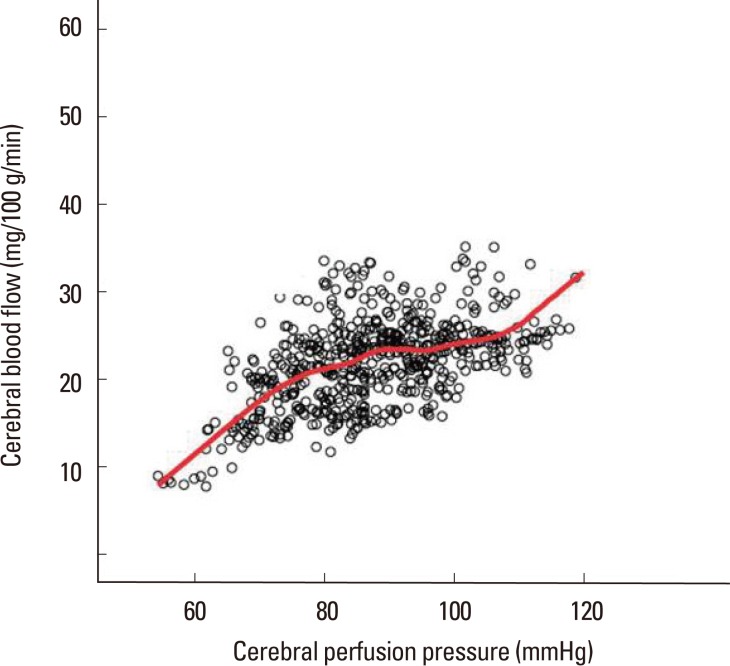
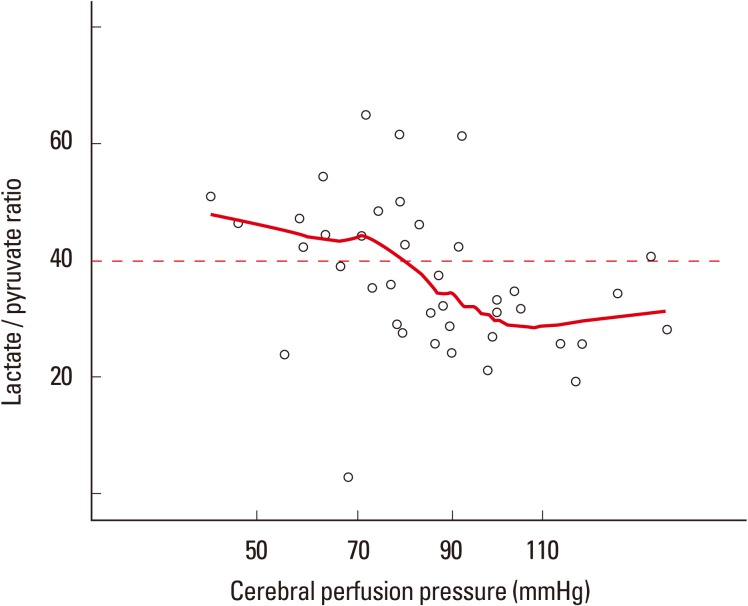
A brain glucose level below 0.7 mM is regarded as a sign of brain tissue energy depletion.38 Because brain glucose concentration is associated with systemic glucose levels, low amounts of systemic glucose may lead to critically low levels of brain glucose (Figure 6). Moreover, abrupt drops (more than 25% reduction) in systemic glucose are independently linked to metabolic crisis, regardless of baseline peripheral glucose levels.39 Therefore, more modest control of brain glucose is required in critical care settings. Since brain glucose concentration is dependent on peripheral glucose concentration, if other conditions are stable, the level of brain glucose can be used to find a threshold for metabolically meaningful CPP in inidividual patients (Figure 7). In patients with ICH, a drop in CPP is associated with a gradual increase in the risk of a metabolic crisis. However, the degree is not strictly dependent upon the level of CPP. The reason for this difference in CPP dependency between metabolic crisis and BTH is not clear, but in patients with ICH, a mitochondrial disturbance may develop when the ICH occurs; thus it is thought to be less dependent on the level of CPP.8 More studies are needed to clarify this issue.
Continuous electroencephalography
The primary reason for electroencephalography (EEG) in the NeuroICU is to detect non-convulsive status epilepticus (NCSE). Previously, NCSE was regarded as a rare phenomenon; however, a recent study revealed that it is more frequently observed than expected.40 Seizures are detected on continuous EEG (cEEG) in as high as 10% of the patients with ischemic stroke. Patients with ICH have a higher seizure risk compared to patients with ischemia; the seizure mostly develop within the first 48 hours.41 Recurrent seizures may aggravate brain injury; seizures in patients with ICH are associated with ICP surges and midline shifts, which underscore the importance of early detection and management of seizures using cEEG monitoring.42 Continuous surface EEG monitoring is generally enough, but a study that used simultaneous surface and intracortical EEG monitoring found that depth electrodes identified more seizure activities, which were often recorded as rhythmic delta activity on surface EEG.43
In addition to the detection of ictal events, cEEG may detect hypoperfusion as hypoperfusion increases slow activity and leads to background attenuation in EEG.44 This concept has been used for detecting vasospasm and ischemic insult during carotid crossclamping in the carotid endarterectomy procedure. More quantitative indices of slowing (alpha/delta ratio) are utilized for detecting hypoperfusionin various NeuroICU settings, including the detection of vasospasm or progression of ischemia with large vessel steno-occlusion. The acute delta change index is reported to be correlated with the degree of perfusion in ischemic stroke.45
Limitation
One big limitation of MMM for patients with severe stroke is its invasiveness. Currently, a non-invasive but accurate monitoring technology does not exist. Moreover, the location of the probe itself is still not standardized. Probes are inserted into the brain tissues at high risk of SBI and therefore, mostly targeted at the perilesional or penumbra area. More studies are needed to accurately identify the proper probe location. We do not know whether additional computed tomography perfusion or magnetic resonance multimodal imaging may help better identify tissues at risk. Although ipsilateral and perilesional brain tissue is optimal for monitoring, patients frequently undergo hemicraniectomy or surgical procedures. Sometimes after such surgical procedures, probes are inserted and fixed to the contralateral side of the lesion. Probe insertion in the apparently healthy side may give false information on tissue health. When handling probes in the contralateral side, special precautions and interpretation are needed to better infer from the monitored information.
As stated above, most of the studies on MMM focused on different types of brain injuries such as TBI and SAH. However, MMM usability is expanding to include cases of large hemorrhagic or ischemic stroke, cardiac arrest, or status epilepticus. These conditions may share similar physiology in terms of an increase in ICP, on-going BTH, or hypoperfusion. However, more direct outcome studies are needed to establish this.
Conclusion
MMM enables us to better understand brain physiology and may help in patient-specific goal-directed therapy. Since each parameter may reflect only 1 aspect of brain physiology, more systematic integration of information on brain physiology is needed in order to understand the underlying mechanisms in brain damage.