Susceptibility-Weighted Imaging for Detection of Thrombus in Acute Cardioembolic Stroke
Article information
Abstract
Background and Purpose
Susceptibility-weighted imaging (SWI) can show an intravascular thrombus as a hypointense susceptibility vessel sign (SVS). In this study, we investigated the usefulness of SWI in the detection of an intravascular thrombus in acute cardioembolic stroke by comparing the SVS on SWI to the vessel status on time-of-flight magnetic resonance angiography (MRA).
Methods
We consecutively enrolled patients with cardioembolic stroke in the anterior circulation within 3 days from stroke onset. The frequency and location of the SVS on SWI were compared with those of occlusion on MRA.
Results
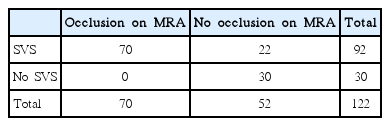
One hundred and twenty-two patients were conclusively enrolled in this study. The SVS was observed in 75.4% (92/122) of the enrolled patients. MRA showed occlusion in 57% (70/122) of the enrolled patients. The SVS was identified in all 70 patients with occlusion on MRA. The SVS was observed in 22 (42.3%) of 52 patients without occlusion on MRA (P<0.001), which was identified mainly in post-bifurcation segments of the middle cerebral artery: the M2 segment in 4 patients, M3 segment in 10 patients, M4 segment in 4 patients, A3 segment in 1 patient, and multiple segments in 2 patients. The mean length of the SVS in the M1 segment was 13.65 mm (median: 12.39 mm, length range: 2.70–39.50 mm).
Conclusions
SWI can provide useful information about the thrombus location, the presence of a single thrombus or multiple thrombi especially in distal intracranial arteries, and the thrombus burden, all in acute cardioembolic stroke.
Introduction
In acute cardioembolic stroke, successful recanalization is crucial because a failure of recanalization is closely associated with poor outcomes after thrombolysis [1]. Recanalization by intravenous thrombolysis (IVT) can be influenced by the burden, composition, and location of a thrombus [2-7]. It would be useful to identify the location and burden of a thrombus before IVT in the planning of the strategy of recanalization therapy.
T2*-weighted gradient echo imaging (GRE) and susceptibility-weighted imaging (SWI) have both been used to identify a thrombus in the form of hypointense signals within occluded arteries, which is termed a “susceptibility vessel sign” (SVS) [6,8-10]. A recent study has shown that SWI is more sensitive than GRE in the visualization of the SVS in the intracranial arteries during the acute phase of ischemic stroke [9]. Furthermore, SWI has been known to have similar sensitivity for the thrombus in proximal intracranial arteries and superior sensitivity for the thrombus in distal intracranial arteries to time-of-flight magnetic resonance angiography (MRA) [10]. These results can be attributed to the characteristics of the SWI sequence, such as the amplification of the T2* signal drop by the deoxyhemoglobin of trapped red blood cells (RBCs) in the thrombus [11]. A thrombus in cardioembolic stroke is known to be composed mainly of RBCs, and therefore, it can be well characterized by SWI.
For this reason, in the present study, we compared the SVS on SWI to the vessel status on MRA and analyzed the SVS frequency according to the time from stroke onset to the MR scan in acute cardioembolic stroke. We also assessed the thrombus burden by measuring the length of the SVS in proximal intracranial arteries.
Methods
Patients
We conducted a retrospective study on stroke patients admitted to our institute between March 2009 and March 2013. Patients were enrolled if they met the following inclusion criteria: (1) acute cerebral infarction in the anterior circulation confirmed by diffusion-weighted imaging, (2) cardioembolism determined by the Trial of Org 10172 in Acute Stroke Treatment classification [12], (3) MR imaging (MRI) performed within 3 days from stroke onset, and (4) MRI performed prior to thrombolytic therapy as long as the patients were treated with IVT or mechanical thrombectomy. We excluded patients with isolated intracranial internal carotid artery (ICA) occlusion, because it may be difficult to differentiate the SVS from susceptibility artifacts of the skull base. Patients with hemorrhagic transformation were excluded, because the SVS cannot be identified under hemorrhagic transformation. To identify the sources of cardioembolism, echocardiography (transthoracic or transesophageal) and 24-hour Holter monitoring were performed in enrolled patients who exhibited any of the following conditions: (1) a history of cardiac disease, (2) an irregular or abnormal rhythm on the electrocardiogram, (3) heart murmur, or (4) no relevant artery stenosis or atherosclerotic risk factors.
MRI protocol
All patients were examined using a 1.5T or 3T MRI unit (Avanto, Verio, Skyra; Siemens, Erlangen, Germany). SWI was performed with the following relevant parameters at 1.5T: repetition time (TR) = 49 ms, echo time (TE) = 40 ms, flip angle = 15°, slice thickness = 2 mm, intersection gaP=0 mm, field of view (FOV) = 184 × 210, and matrix number = 320 × 227. Similarly, it was performed with the following relevant parameters at 3T: TR = 28 ms, TE = 20 ms, flip angle = 15°, slice thickness = 2 mm, intersection gaP=0 mm, FOV = 184 × 210, and matrix number = 320 × 227. MRA was performed using a three-dimensional sequence with the following parameters at 3T: TE = 3.9 ms, TR = 21 ms, flip angle = 18°, FOV = 168 × 240 mm, slice thickness = 0.6 mm, and pixel spacing = 0.53; this resulted in an acquisition time of 2 minutes 59 seconds. Similarly, MRA was performed using a three-dimensional sequence with the following parameters at 1.5T: TE = 7 ms, TR = 24 ms, flip angle = 25°, FOV = 168 × 280 mm, slice thickness = 0.5 mm, and pixel spacing = 0.625; this resulted in an acquisition time 2 minutes 59 seconds.
Imaging analysis
The SWI were reviewed independently by two vascular neurologists (MG Park and KP Park) who were blinded to the clinical data and to other MR sequences. The SVS was defined as the hypointense signal on SWI within the vessels, exceeding the size of the homologous contralateral arterial diameter (Figure 1). The length of the SVS in the M1 segment was measured at the slice with the longest SVS. Vessel occlusion was defined as signal disruption on MRA (Figure 1). The MRA was independently reviewed by a vascular interventionist (SJ Oh) who was blinded to the clinical data and to other MR sequences.
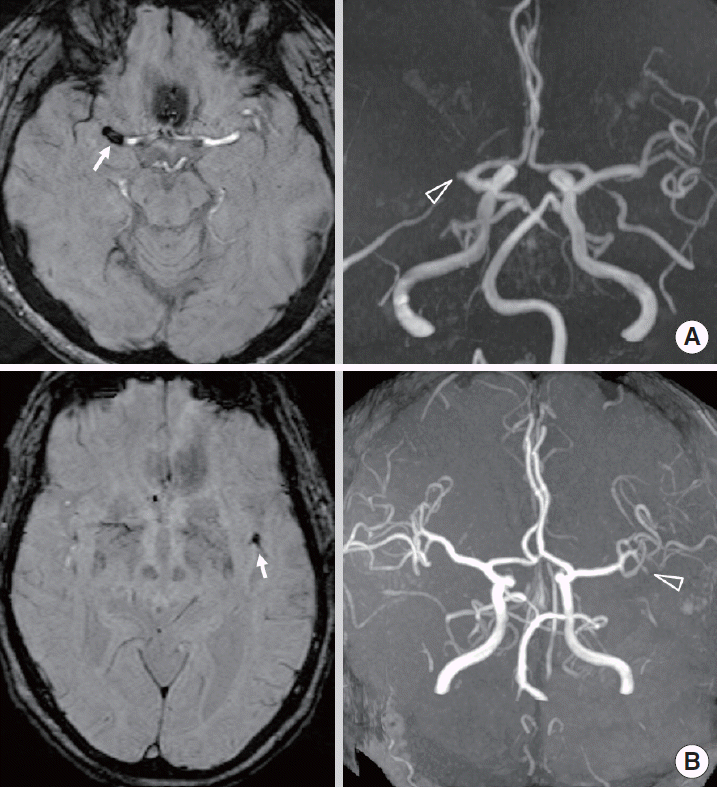
(A) Susceptibility-weighted imaging (SWI) shows susceptibility vessel sign (SVS, arrow) in M1 segment of right middle cerebral artery (MCA). MR angiography (MRA) shows occlusion (open arrowhead) in M1 segment of right MCA. (B) SWI shows SVS (arrow) in M2 segment of left MCA. MRA shows occlusion (open arrowhead) in left M2 segment.
Statistical analysis
The McNemar test was performed with the aim of comparing the SVS on SWI with the occlusion on MRA. The interobserver variability of the SVS was analyzed by k-statistics. Pearson’s χ2 test was performed for evaluating the frequency of the SVS in the time from stroke onset to the MR scan (i.e., ≤ 24 hours and 24-72 hours). The Mann-Whitney U test was performed for comparing the frequencies of the SVS on SWI and the frequencies of the occlusions on MRA between the 1.5T and 3.0T MR units. The data were analyzed using the Statistical Package for Social Sciences software for Windows (ver. 21; IBM, Armonk, New York). Statistical significance was defined as P<0.05.
Results
A total of 122 patients (including 71 females aged between 43 and 92 years) were finally enrolled in our study. The baseline characteristics of the patients are summarized in Table 1. The time interval from stroke onset to the MR scan ranged from 1.5 hours to 72 hours (mean: 19.3 ± 13.6 hours). MRI was performed on a 3.0T MR unit in 69.7% (85/122) of the enrolled patients and on a 1.5T MR unit in 30.3% (37/122) of the enrolled patients.

Patient demographics
The SVS was detected in 75.4% (92/122) of the enrolled patients. Interpretation of the SVS showed good agreement between the neurologists (k = 0.824, P<0.001). No significant difference in the frequency of the SVS was observed between the 1.5T MR unit and the 3.0T MR unit (P=0.487): 75.7% (28/37) in the 1.5T MR unit and 75.3% (64/85) in the 3.0T MR unit. Multiple SVSs were detected in 9 of 92 patients with the SVS (9.8%). In 7 patients with multiple SVSs, all the SVSs were identified in the vascular territory distal to the primary occluding segment. In the remaining 2 patients with multiple SVSs, the SVSs were found in different vascular territories. MRA showed occlusions in 70 of 122 patients (57.4%): occlusion of the M1 segment in 39 patients, of the M2 segment in 14 patients, of the M3 segment in 1 patient, of the distal ICA in 5 patients, as well as carotid-T occlusion in 6 patients and multiple occlusions in 5 patients. No significant difference in the frequency of occlusion on MRA was observed between the 1.5T MR unit and the 3.0T MR unit (P=0.272): 64.9% (24/37) in the 1.5T MR unit and 54.1% (46/85) in the 3.0T MR unit. The SVS was identified in all 70 patients with symptomatic occlusion on MRA (Table 2). In 2 patients with the M1 occlusion on MRA, the SVS was detected in not only the M1 segment but also the M3 segment of one patient and in the P3 and A3 segments of the other patient: occlusion of the distal arteries was not detected on MRA. The representative case is shown in Figure 2. The SVS was observed in 22 (42.3%) of 52 patients without occlusion on MRA (P<0.001), which was identified mainly in the post-bifurcation segments of the MCA: in the M2 segment in 4 patients, in the M3 segment in 10 patients, in the M4 segment in 4 patients, in the A3 segment in 1 patient, and in multiple segments in 2 patients. The SVS was not detected in 24.6% (30/122) of the enrolled patients, who showed no occlusion on MRA. MRI was performed on 91 patients (74.6%) within 24 hours from stroke onset and on 31 (26.4%) patients 24-72 hours after stroke onset: the SVS was detected in 81.3% (74/91) and 20.2% (18/31) in each group (Figure 3, P=0.009).
Comparison of susceptibility-weighted imaging and time-of-flight MR angiography for detecting arterial occlusion

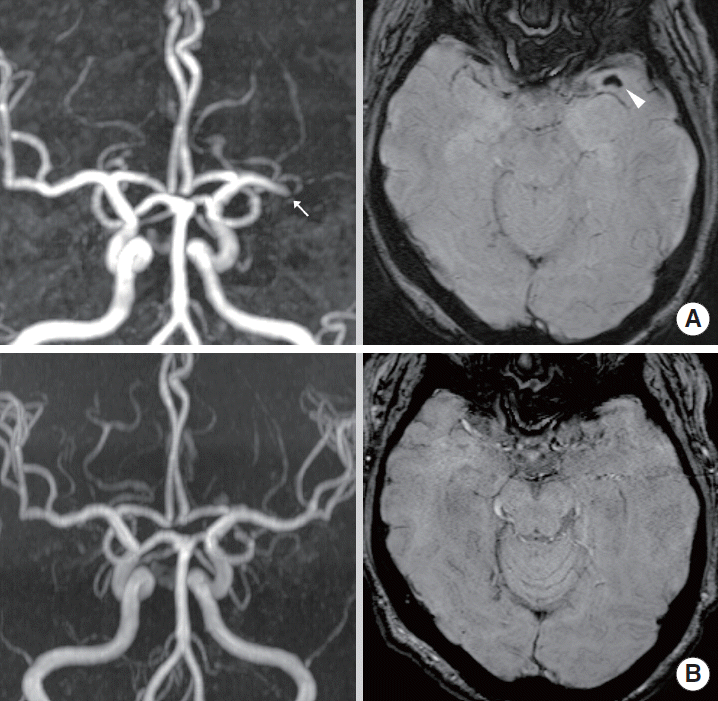
(A) Susceptibility-weighted imaging (SWI) shows multiple susceptibility vessel signs (SVSs) in distal M1 (arrowhead) and M3 (open arrowhead) segments of left middle cerebral artery (MCA). (B) MR angiography (MRA) does not show definite occlusion site except for distal M1 occlusion (arrow) of left MCA.

Frequency of susceptibility vessel sign (SVS) on susceptibility-weighted imaging in cardioembolic stroke patients in the time from stroke onset to MR scan. *P=0.009 by Pearson’s chi-square test.
The length of the SVS was measured in 49 patients with the thrombus in the M1 segment. The SVS length in the post-bifurcation segments was not measured, because these segments run vertically on the surface of the insula or obliquely on the cerebral cortex. The mean length of the SVS in the M1 segment was 13.65 mm (median: 12.39 mm, length range: 2.70-39.50 mm).
Discussion
Our results show that SWI is more sensitive than MRA for detecting a thrombus in acute cardioembolic stroke, and it is especially sensitive for detecting a single thrombus or multiple thrombi in distal intracranial arteries. MRA is useful in evaluating intracranial arteries, but it has a limitation in terms of visualizing abnormalities of distal intracranial arteries because of its insensitivity to slow flow or slow in-plane flow [13]. The SVS has been first reported through a study using T2*-weighted MRI [14]. However, the detection rate of the SVS is inconsistent among previous studies conducted using GRE: the heterogeneous etiologies of the enrolled stroke patients may affect the inconsistent sensitivity of the SVS on GRE [13-15]. The study of Cho et al. showed that the SVS on GRE was detected in 47.4% of 95 patients, especially in 77.5% of 40 patients with cardioembolic stroke [8]. Furthermore, a recent study conducted using SWI in acute posterior cerebral artery infarction showed that cardioembolism is the most frequent etiology in patients with the SVS [17]. Each human RBC contains approximately 270 million hemoglobin molecules [18]. Fully deoxygenated hemoglobin has four unpaired electrons. If one RBC is completely unsaturated, one RBC will have approximately 1,080 million unpaired electrons, which are sources of a strong paramagnetic property [11]. Therefore, in cardioembolic stroke, the higher detection rate of the SVS on SWI than that of occlusion on MRA is most probably because SWI can emphasize the “red thrombus” on account of the paramagnetic property induced by the unpaired electrons of deoxyhemoglobin.
In our study, 9.8% of the enrolled patients showed multiple SVSs on SWI. MRA did not detect all of the multiple thrombi seen on the SVS, especially the distal thrombus. The limitation of MRA in the detection of multiple thrombi is attributable mainly to its dependence on blood flow, which fails to reach distal vessel occlusion on account of a decrease in or absence of blood flow through proximal vessel occlusion. A recent study assessed the prevalence of multiple thrombi before thrombolytic therapy in acute ischemic stroke by using SWI; multiple thrombi were detected on pretreatment SWI in 7.4% of the patients with acute ischemic stroke, and the most frequent etiology in patients with multiple thrombi was cardioembolic stroke [19]. Therefore, SWI is an appropriate sequence for evaluating the location and number of thrombi and for acute stroke imaging.
Our findings are similar to those of the study of Radbruch et al. in that they showed that SWI and MRA exhibit similar sensitivities for the detection of a thrombus in major arteries, whereas SWI is superior to MRA in the detection of a thrombus in distal arteries. However, because Radbruch et al. did not provide information about the stroke etiology of enrolled patients, it was unclear whether detection rate of SVS would be affected according to the stroke etiology [10]. The SVS frequency in our study was lower than that in their study (75.4% in the former versus 92.6% in the latter). In their study, MR images were acquired within 4.6 ± 2.5 hours after the onset of symptoms in 33 patients with clear-onset stroke and within a maximum of 18 hours in 61 patients with unclear-onset stroke [10]. Therefore, our lower detection rate of the SVS is most probably a result of later MR acquisition times than those in the study of Radbruch et al. Indeed, in our study, the SVS detection rate increased by 81.3% in patients within an early time window of 24 hours after stroke onset, which is higher than the SVS detection rate on GRE of cardioembolic stroke in the study of Cho et al. [8]. However, in our study, the SVS was not detected in 18.7% of the patients even though they were within an early time window; this can be explained by the occurrence of early spontaneous recanalization in cardioembolic stroke. It is well known that spontaneous recanalization frequently occurs in the early times of cardioembolic stroke [20]. In fact, our study showed that the SVS frequency drops significantly 24 hours after stroke onset (Figure 2): early spontaneous recanalization may affect the negative detection of the SVS in patients within early time windows and the low detection rate of the SVS in patients within later time windows. Another possibility is that the thrombus was not detected on SWI, because it may be a white clot composed mainly of fibrin [21]; however, even if the thrombus is a white clot, which cuts off the blood flow, MRA would be able to show vessel occlusion in at least the M1 segment. However, in our study, MRA could not show occlusion in all the patients without the SVS on SWI. Therefore, it is less likely that the thrombus was not detected on SWI because of the white clot.
Recently, Legrand et al. suggested that the clot burden score using the SVS on GRE is useful in the prediction of recanalization in hyperacute stroke patients treated by IVT [6]. Previous studies have suggested that an RBC-rich thrombus is more sensitive to IVT than is a platelet-rich thrombus [5,22]. The number of RBCs in a thrombus is known to affect the susceptibility effect: the stronger the susceptibility effect, the higher is the number of RBCs that may be included in the thrombus [8,23]. In our study, SWI was found to be more useful than MRA in defining the location of the thrombus and in determining its burden in the M1 segment. Therefore, although a recent study has shown that the thrombus burden on SWI does not affect the success of endovascular recanalization therapy [24], we suggest that further study is required to evaluate whether or not the response to IVT is affected by the thrombus burden using the SVS on SWI [6,7]. A representative case is shown in Figure 4.
(A) 54 year-old woman (initial NIHSS score: 15) showed left M1 occlusion on MR angiography (MRA, arrow). Susceptibility-weighted imaging (SWI) before intravenous thrombolysis (IVT) shows susceptibility vessel sign (SVS, arrowhead) in left M1 segment. IVT was performed within 4 h from stroke onset. (B) Follow-up MRA after IVT shows recanalization of left M1. Follow-up SWI shows no SVS in left M1 segment. At 3 months, the modified Rankin scale of the patient was 0.
Our study had some limitations. First, we enrolled patients with cardioembolic stroke in later time windows. Therefore, further study will be required to confirm our results for cardioembolic stroke within the time window for thrombolytic therapy. Second, we enrolled patients of only cardioembolic stroke; therefore, our results cannot be generalized to stroke due to other etiologies. However, the characteristic of SVS on SWI considered in our study would be useful in understanding a thrombus due to cardioembolism. Third, 1.5T and 3T MR units were employed in our study. Although a higher field strength would enhance the detection of cerebral microbleeds on SWI [25], it is not known whether a higher field strength would affect the detection of the SVS: in our study, the SVS detection rate did not differ between the 1.5T and 3T MR units. Fourth, different field strengths of MR units may affect occlusion detection on MRA [26].
Conclusions
SWI is highly useful in defining the location of a thrombus, especially of a single thrombus or of multiple thrombi in distal intracranial arteries, in acute cardioembolic stroke. In addition, SWI provides information about the thrombus burden and a distal intracranial thrombus, which cannot be obtained from MRA. We believe that SWI can be a useful MR sequence for assessing the thrombus location and burden in acute cardioembolic stroke.
Acknowledgements
This study was supported by the Research Institute for Convergence of biomedical science and technology Gran (30-2013-005), Pusan National University Yangsan Hospital.
We sincerely thank Chang O Son for the grammar check.
Notes
The authors have no financial conflicts of interest.