Impact of Slow Blood Filling via Collaterals on Infarct Growth: Comparison of Mismatch and Collateral Status
Article information
Abstract
Background and Purpose
Perfusion-diffusion mismatch has been evaluated to determine whether the presence of a target mismatch helps to identify patients who respond favorably to recanalization therapies. We compared the impact on infarct growth of collateral status and the presence of a penumbra, using magnetic resonance perfusion (MRP) techniques.
Methods
Consecutive patients who were candidates for recanalization therapy and underwent serial diffusion-weighted imaging (DWI) and MRP were enrolled. A collateral flow map derived from MRP source data was generated by automatic post-processing. The impact of a target mismatch (Tmax>6 s/apparent diffusion coefficient (ADC) volume≥1.8, ADC volume<70 mL; and Tmax>10 s for ADC volume<100 mL) on infarct growth was compared with MR-based collateral grading on day 7 DWI, using multivariate linear regression analysis.
Results
Among 73 patients, 55 (75%) showed a target mismatch, whereas collaterals were poor in 14 (19.2%), intermediate in 36 (49.3%), and good in 23 (31.5%) patients. After adjusting for initial severity of stroke, early recanalization (P<0.001) and the MR-based collateral grading (P=0.001), but not the presence of a target mismatch, were independently associated with infarct growth. Even in patients with a target mismatch and successful recanalization, the degree of infarct growth depended on the collateral status. Perfusion status at later Tmax time points (beyond the arterial phase) was more closely correlated with collateral status.
Conclusions
Patients with good collaterals show a favorable outcome in terms of infarct growth, regardless of the presence of a target mismatch pattern. The presence of slow blood filling predicts collateral status and infarct growth.
Introduction
The use of magnetic resonance imaging (MRI) to predict the response to early recanalization therapy and to identify patients for delayed treatment is attractive. However, recent trials have showed controversial results that selecting patients using a mismatch paradigm is a useful technique for identifying patients who would differentially benefit from recanalization therapy [1-3]. Continuous efforts have been made by researchers to determine the optimal definition of a target mismatch pattern, such as the mismatch ratio and Tmax threshold [4-9].
In patients with acute ischemic stroke, both antegrade flow and (delayed) retrograde collateral flow maintain cerebral perfusion within ischemic regions. We have reported that the angiographic collateral grade determines the rate of recanalization, hemorrhagic transformation, and infarct growth after revascularization therapy [10-12]. Patients with poor collateral flow have shown a low recanalization rate regardless of the mode of revascularization therapy or the site of the occlusion [11]. Even if recanalization is achieved after revascularization therapy, these patients often experience clinical deterioration due to symptomatic hemorrhagic transformation [12]. Recanalization is only related to a positive clinical outcome if adequate collateralization prevents infarction until the vessel is recanalized [10,13], and a good collateral status could feasibly extend the time window for endovascular procedures [14,15].
Our hypothesis is that delayed perfusion (slower blood filling at later Tmax time points) via collaterals better predicts infarct growth than the perfusion status at earlier Tmax time points. In the present study, we evaluated the correlation between perfusion-diffusion mismatch and the collateral status. This was measured by a specific technique we developed to evaluate collateral flow using dedicated MRI sequences generated from magnetic resonance perfusion (MRP) source data, which yields an excellent correlation with the collateral status graded using conventional angiography [16]. In addition, the impact of slow blood filling via collaterals on infarct growth was compared with that of a target mismatch on MRP.
Methods
Patient selection
Using data from a prospectively maintained registry, we identified patients who were considered eligible for recanalization therapy for acute infarction within the middle cerebral artery (MCA) territory. Data from consecutive patients who were treated from June 2005 to December 2012 at a university medical center were analyzed retrospectively. Inclusion criteria for this study were: (1) subjects who presented within 6 hours of symptom onset; (2) subjects who underwent serial brain MRI, including diffusion-weighted imaging (DWI), MRP, and MR angiography (MRA), at admission and at day 7; (3) subjects who had a NIH Stroke Scale (NIHSS) score of 4 or more points at admission; and (4) subjects with internal carotid artery and/or proximal MCA (M1 segment) occlusion associated with symptoms on admission MRA (Supplementary Figure 1). This study was approved by the local institutional review board. All patients gave written informed consent for participation in the study.
Patients were evaluated based on demographic data, medical history, vascular risk factors, routine blood tests, brain imaging, and cardiological assessments, according to a protocol. Stroke mechanisms were subtyped using the trial of ORG 10172 in acute stroke treatment (TOAST) classification [17], and were diagnosed by the consensus of two stroke neurologists. Serial assessments of stroke severity using the NIHSS were performed during hospitalization and whenever neurological deterioration occurred.
MR perfusion methods and image analysis
MRI was performed using a 3T Philips Achieva MR scanner (Philips Medical Systems, Best, the Netherlands). Pretreatment DWI and MRP assessments were performed on all patients. Post-treatment MRP was also performed on all patients 7 days after treatment. Additional MRI scans were performed after any signs of clinical deterioration.
Typical MRI sequences for acute stroke included at least DWI, dynamic susceptibility contrast-enhanced MRP (DSC-MRP), fluid-attenuated inversion recovery, and MRA of the cervical and intracranial vessels (3-dimensional time-of-flight MRA and contrast-enhanced MRA, including extracranial carotid and vertebral arteries). DWI was obtained with two levels of diffusion sensitization (b values of 0 and 1,000 s/mm2; 5- to 7-mm slice thickness; and no gap). DSC-MRP was performed using gradient-echo and echo-planar imaging techniques after administration of intravenous gadolinium (Dotarem (gadoterate meglumine); Guerbet, Aulnay-sous-Bois, France), with a repetition time of 1,718 milliseconds for a total acquisition time of approximately 90 seconds with 20 slices. Contrast agent was injected at a dose of 0.1 mmol/kg body weight with a flow rate of 3 mL/s by a power injector into an antecubital vein via an 18-gauge intravenous cannula about 7 seconds after beginning the acquisition. Other parameters for DSC-MRP were as follows: echo time=35 ms, flip angle=40°, acquisition matrix=128×128, field of view=24×24 cm2, section thickness=5 mm, and intersection gap=2 mm. In total, 1,000 DSC-MRP raw images, composed of 50 time points per slice, were obtained.
Slow blood filling was defined based on the perfusion parameter Tmax. Tmax is the time to the peak of the residue function map generated by deconvolution of the tissue concentration over the time curve, using an arterial input function from the contralateral MCA [18]. MRP post-processing and data analysis were performed as described in our previous studies [19]. MRI volume measurements were performed semiautomatically using a computer-assisted volumetric analysis program (Medical Image Processing, Analysis and Visualization, Version 3.0; NIH, Bethesda, Md) by an investigator who was blinded to the clinical information.
The presence of a “target mismatch” pattern was defined based on the following criteria proposed in the Diffusion and Perfusion Imaging Evaluation For Understanding Stroke Evolution study-2 (DEFUSE-2) trial: (a) a ratio of 1.8 or more between the volumes of critically hypoperfused tissue (Tmax>6 s) and the ischemic core based on an apparent diffusion coefficient (ADC) threshold of <600×10-6 mm2/s, with an absolute difference of 15 mL or more, (b) ischemic core volume of less than 70 mL, and (c) less than 100 mL of tissue with a severe delay in bolus arrival (Tmax>10 s) [7].
Post-processing techniques to generate an MRP-derived collateral flow map
Collateral flow maps were generated based on source data derived from DSC-MRP, as previously described [16]. Collateral flow maps were automatically generated using a in-house software named FAST-COLL (Fast Analysis SysTem for COLLaterals) that was developed using MATLAB (MathWorks, Natick, MA). All these steps were typically completed within five minutes (Figure 1).

Basic scheme showing the FAST-COLL (Fast Analysis SysTem for COLLaterals) workflow. After the onset of symptoms, patients arrived at the hospital and the MRI data were acquired using typical MR sequences such as diffusion-weighted imaging (DWI), dynamic susceptibility contrast-enhanced magnetic resonance perfusion (DSC-MRP), and MR angiography (MRA). The MRI technician then transferred the MR raw data from the operating computer to the workstation using the file transfer program. The collateral flow map was automatically generated by FAST-COLL, and the stroke neurologist or radiologist evaluated the grade of collateral flow. All steps were typically completed within 5 minutes. The collateral flow map can also be easily viewed on the hospital picture archiving and communications system with other images.
Criteria for the collateral flow map–based collateral grade were chosen based on the concept of the American Society of Interventional and Therapeutic Neuroradiology/Society of Interventional Radiology (ASITN/SIR) scale. Specifically, a poor grade (grade 1) was defined as no collaterals visible or slow collaterals (visible only in the late phase) to the part of the occluded MCA territory with persistence of some of the defect; intermediate grade (grade 2) was defined as rapid collaterals (visible in the mid to late phase) to the part of the occluded MCA territory with persistence of some of the defect; good grade (grade 3) was defined as slow but complete collateral flow to the occluded MCA territory; and excellent grade (grade 4) was defined as complete and rapid collateral flow to the vascular bed in the occluded MCA territory. Six axial slices of the collateral flow maps were used to assess leptomeningeal collateral grade. For statistical analysis, patients were divided into three groups, according to the grade: grade 1 (poor), grade 2-3 (intermediate), and grade 4 (good). Collateral flow images were reviewed independently by two investigators with knowledge of the symptomatic side and the site of occlusion. When the judgment of the two raters was inconsistent, a decision was made by consensus.
Recanalization therapy and thrombolysis in cerebral infarction (TICI) grading
The majority of the patients underwent endovascular treatment, including intra-arterial thrombolysis, angioplasty, stenting, and/or mechanical embolectomy, at the discretion of the attending physicians. Vascular reperfusion was based on the TICI classification, with assignments of 0, no perfusion; 1, penetration with minimal perfusion; 2a, <67% perfusion; 2b, ≥67% perfusion; and 3, complete perfusion of the affected vascular territory [20]. In 13 patients who did not undergo endovascular treatment, TICI was determined with MRA at day 1. Twelve patients showed complete occlusion on follow up MRA and classified as having TICI 0 [20]. In one patient with partial spontaneous recanalization at day 1, TICI grade could not be determined because timing of recanalization was not clear. TICI score was determined based on a consensus between two readers.
Outcome measurements
Infarct growth was defined as the difference between pretreatment lesion on ADC and final DWI infarct volume at day 7.
Statistical analysis
All data are presented as medians (25-75th percentile) or numbers (percentages), unless otherwise specified. The Mann–Whitney U test or Kruskal–Wallis test was used to compare continuous variables, and Pearson’s chi-square test or Fisher’s exact test was used to compare categorical variables between groups. We used the Bonferroni method to correct for multivariable comparisons. Predictors for infarct growth were first evaluated by univariate linear regression. Possible predictors that could influence infarct growth were age, baseline severity of stroke (NIHSS score and DWI infarct volume), recanalization (TICI scale), glucose level, time from MRI to recanalization therapy, the presence of the target mismatch pattern, and MRP-based collateral grade on pretreatment MRI. Multivariable linear regression models were then applied to analyze the independent contribution of factors with univariate P values of <0.1. A P value of <0.05 was considered statistically significant.
Results
Of the 79 patients who met the inclusion criteria during the study period, 73 (92.4%) patients were finally enrolled in this study. Six patients were excluded due to technically suboptimal imaging data: (a) the inability to generate a collateral flow map due to poor contrast bolus (n=2), and (b) failure of MRI post-processing for Tmax due to excessive patient motion or the absence of an identifiable, technically adequate arterial input function (n=4). Baseline characteristics are presented in the Supplementary Table 1.
Of the 73 patients enrolled, 55 patients (75%) showed a target mismatch pattern. The MRP-based collateral grading was poor in 14 (19.2%) patients, intermediate in 36 (49.3%), and good in 23 (31.5%). The weight kappa (kw) values for intra-observer agreement of the MRP-based collateral grade were 0.842 (95% confidence interval (CI), 0.733-0.950) and 0.851 (95% CI, 0.754-0.948) for the two reviewers respectively, while the kw value for inter-observer agreement was 0.817 (95% CI, 0.704-0.931). Patient characteristics and the treatment response depending on the degree of collateral circulation are illustrated in Table 1. General characteristics were not different among the groups; except, current smoking was more prevalent and cardioembolism was less prevalent in patients with good collaterals. However, the baseline severity, as assessed by NIHSS score and DWI lesion volume, differed depending on the pretreatment collaterals. A trend was found between the collateral groups for the presence of a target-mismatch pattern (P for trend=0.054).
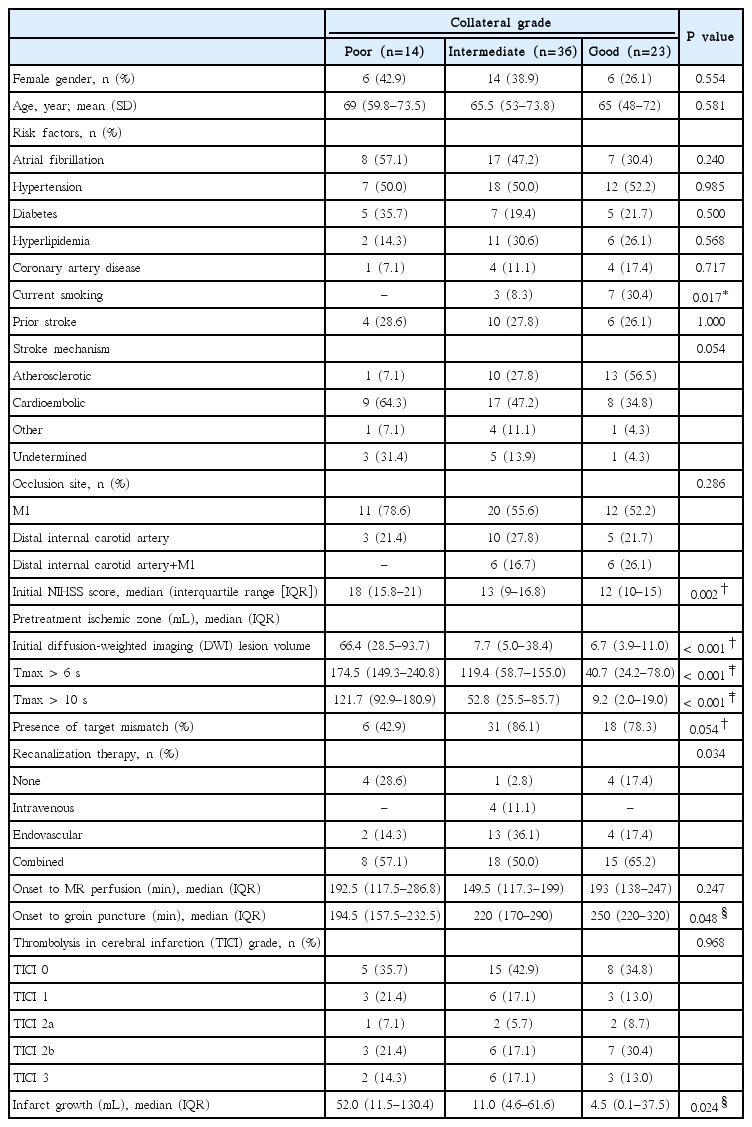
Patient characteristics depending on the MR perfusion-based collateral grading
Although there was no significant difference in TICI grade among the collateral groups (P=0.968) and the time interval between onset-to-treatment was shorter in the poor collateral group (P=0.048), patients with poor collaterals definitely had larger infarct growth (median, interquartile range [IQR]; 52.0 [11.5-130.4] mL), compared with those with intermediate collaterals (11.0 [4.6-61.6] mL), or good collaterals (4.5 [0.1-37.5] mL) (P=0.024). Post-hoc analysis revealed a significant difference in the volume of infarct growth between the poor and good collateral groups (P=0.018).
Multivariable regression analysis was performed to evaluate the independent predictors for infarct growth further (Table 2). The attainment of recanalization represented by the TICI grade (B=-16.7, standard error mean (SE)=3.65, P<0.001) and MRP-based collateral grading (B=-15.8, SE=6.20, P=0.013) were independently associated with infarct growth, adjusting for other variables. Controlling for other factors, including age, initial severity of stroke (NIHSS score and DWI volume), glucose level, MR to groin puncture time, and the presence of target mismatch, did not significantly change the effect of the pretreatment collateral grade. When the MRP-based collateral grading was not entered into the same model, the presence of a target mismatch was not independently associated with infarct growth (data not shown).

Multivariate linear regression analysis for infarct growth
Moreover, among patients who were homogenous in terms of the presence of a target mismatch and occurrence of recanalization, the degree of infarct growth was different depending on the MRP-based collateral grading. As shown in Figure 2, the degree of infarct growth in patients with a target mismatch pattern and successful recanalization differed depending on the collateral status. The volume of infarct growth was higher in patients with poor collaterals (median [IQR], 26 [16.6-33.9] mL) than those with intermediate (7.8 [-0.6-24.1] mL) or good (1.8 [-0.2-3.8] mL) collaterals, although the difference is statistically insignificant due to the small sample size (P=0.108).
Degree of infarct growth depending on the collateral grade between recanalized and not recanalized.
A significantly lower volume of infarct growth was observed among patients in whom recanalization (TICI grade 2-3) had been observed, regardless of collateral status and the presence of a target mismatch pattern (Figures 2 and 3B). Infarct growth, expressed as median (IQR), in patients with recanalization vs. nonrecanalization was 10.4 (1.1-29.9) mL vs. 112.4 (69.7-148.5) mL in patients with poor collaterals (P=0.001), 7.4 (-1.4-23.5) mL vs. 20.1 (5.3-99.4) mL in those with intermediate collaterals (P=0.041), and 0.5 (-0.5-4.1) mL vs. 37.5 (17.3-46.2) mL in those with good collaterals (P<0.001). Similarly, infarct growth in patients with recanalization vs. non-recanalization was 4.6 (-0.1-23.5) mL vs. 25.6 (8.8-94.3) mL in patients with a target mismatch pattern (P=0.001), and -0.1 (-6.4-10.5) mL vs. 95.3 (36.2-164.1) mL in those without a target mismatch pattern (P=0.001).
(A) Perfusion status depending on the collateral status and the spearman’s correlation analysis of association of Tmax threshold and magnetic resonance perfusion (MRP)-based collateral grading. (B) Pretreatment (1) color-coded Tmax image, (2) diffusion-weighted imaging (DWI) images, and (3) collateral flow map findings in a patient with good collaterals (grade 3) on conventional angiography. Slow but almost complete blood filling was observed in (3) venous phase (right panel) of collateral flow map and (4) corresponding Tmax maps (Tmax 16-22 s).
Spearman’s correlation analysis showed that degree of perfusion delay correlated significantly with MRP-based collateral grade throughout Tmax >2 s to Tmax >24 s, but perfusion status at a later Tmax time points more closely correlated with collateral status (Figure 3A). Perfusion status at earlier Tmax time points was similar among patients with different collateral status. Figure 3B shows an example of a patient with good collaterals; although MRP showed extensive areas of Tmax delay up to 10 seconds, most of them were reperfused at a later Tmax time point.
Discussion
The main findings of the present study are as follows: (a) the attainment of early recanalization and the MRP-based collateral grading, but not the presence of a target mismatch pattern, were independently associated with infarct growth, (b) a target mismatch pattern on MRP was very common, and showed a poor correlation with pretreatment collaterals, and (c) collateral status was predicted by perfusion status at later Tmax time points but not by the extent of perfusion defects at earlier Tmax time points.
The hemodynamic effects of the collateral circulation are important for maintaining perfusion to penumbral regions [21]. In this study, there was a complex interplay between the extent of MRP-based collaterals, the presence of a target mismatch pattern, the attainment of recanalization, and the occurrence of infarct growth. Our data illustrate that collaterals and mismatch represent related, yet distinct, aspects of ischemic pathophysiology. There was a modest correlation between collateral grades and the presence of a target mismatch. Collaterals may influence the severity of ischemic injury, while the mismatch concept represents the extent of relatively mild hypoperfusion. Most currently used perfusion parameters such as time to peak, Tmax (deconvoluted time to peak), and mean time to transit have focused on the early part of the vascular phase (arterial and early capillary), whereas collateral evaluation (angiographic or MRP-based collateral maps) reflects the later phase (late capillary or venous). Our results showed that the perfusion status at later Tmax time points was more closely correlated with collateral status than that at earlier Tmax time points.
In the present study, the MRP-based collateral grading, but not the presence of a target mismatch pattern, were independently associated with infarct growth. Moreover, the degree of infarct growth differed depending on the collateral status, regardless of the presence or absence of a target mismatch pattern or successful recanalization. The results of the present study are in good agreement with our previous study showing that poor collaterals on conventional angiography are an important determinant of infarct growth, irrespective of the degree of recanalization [10]. We used MRP-based collateral map, which can provide information about collateral circulation with good intra- and inter-observer agreement and avoid possible risk of thrombotic complications related to conventional angiography [16].
However, it should be mentioned that MRI mismatch pattern is an MRI profile primarily used to identify patients that have more chances to benefit from treatment, rather than to predict clinical outcome. Moreover, although no significant association was observed between the collateral status and the target-mismatch pattern in the present study, collateral status is closely linked with perfusion-diffusion mismatch pattern. Results of others and our previous studies showed that better collateral flow at baseline was associated with larger perfusion–diffusion mismatch [22,23]. Results of the present study indicate the importance of perfusion status at later Tmax time points (presence of slow blood filling via collateral flow) on infarct growth, rather than perfusion status at earlier Tmax time points. Our recent study of probabilistic approach with a Tmax-derived prediction model showed that Tmax severity-weighted model predicts poor collaterals with high predictive power [24]. Therefore, image of collateral flow could provide additional information to perfusion-diffusion mismatch concept in the estimation of risk-benefits of revascularization therapy for acute ischemic stroke. Our results indicate that attainment of early recanalization is an important determinant of tissue fate, regardless of the presence of penumbral regions and the collateral grading. Therefore, in using MRI for acute stroke patients, it would be worthwhile to identify patients who are likely to be harmed by successful recanalization, rather than identifying those who are likely to show a favorable response to recanalization therapy. Besides a large DWI lesion volume, poor collaterals and the related severe hypoperfusion are reported to be associated with adverse effects (i.e., hemorrhagic transformation) [12,19,25].
This study has limitations. First, the results of this study should be interpreted with caution because of the limited sample size, and different treatment modalities. This was an observational study at a single medical center. Further prospective studies are warranted to fully validate the usefulness of MRP-based collateral evaluations. Second, our post-processing technique was different to that used in the DEFUSE-2 trial (RAPID software) [7]. Third, further studies using other imaging modalities to assess collateral status are needed to confirm our results [26]. Lastly, some of the more substantial lesion growth in patients with poor collaterals may be related to the edema in patients with larger DWI lesions.
In conclusion, our results indicate that aside from the current diffusion-perfusion mismatch concept, the status of collateral flow generated from MRP source data may be a robust predictor of outcome in acute MCA stroke with large artery occlusion. Given that we used routine MRP source images in this study, the application of our method in a rapid prospective fashion is likely to be feasible in an acute clinical setting. A prospective study is ongoing to evaluate the impact of collateral flow on stroke outcome using this approach (clinical trial identifier NCT02668627 at clinicaltrial@gov). Although continuous efforts should be made to determine the optimal definition of penumbra, further studies are also needed to determine the optimal MRP parameters and thresholds for the measurement of collateral status.
Notes
This research was supported by a grant of the Korea Health Technology R&D Project through the Korea Health Industry Development Institute (KHIDI), funded by the Ministry of Health & Welfare, Republic of Korea (HI14C1531 and HC15C1056).
The authors have no financial conflicts of interest.
Supplementary Material
General characteristics
Patient selection