Aberrant Promoter Hypomethylation of Sortilin 1: A Moyamoya Disease Biomarker
Article information
Abstract
Background and Purpose
The pathogenesis of moyamoya disease (MMD) remains poorly understood, and no reliable molecular biomarkers for MMD have been identified to date. The present study aimed to identify epigenetic biomarkers for use in the diagnosis of MMD.
Methods
We performed integrated analyses of gene expression profiles and DNA methylation profiles in endothelial colony forming cells (ECFCs) from three patients with MMD and two healthy individuals. Candidate gene mRNA expression and DNA methylation status were further validated using reverse transcription-quantitative polymerase chain reaction (RT-qPCR) and pyrosequencing analysis of an expanded ECFC sample set from nine patients with MMD and ten controls. We evaluated the diagnostic accuracy of the potential biomarkers identified here using receiver operating characteristic curve analyses and further measured major angiogenic factor expression levels using a tube formation assay and RT-qPCR.
Results
Five candidate genes were selected via integrated analysis; all five were upregulated by hypomethylation of specific promoter CpG sites. After further validation in an expanded sample set, we identified a candidate biomarker gene, sortilin 1 (SORT1). DNA methylation status at a specific SORT1 promoter CpG site in ECFCs readily distinguished patients with MMD from the normal controls with high accuracy (area under the curve 0.98, sensitivity 83.33%, specificity 100%). Furthermore, SORT1 overexpression suppressed endothelial cell tube formation and modulated major angiogenic factor and matrix metalloproteinase-9 expression, implying SORT1 involvement in MMD pathogenesis.
Conclusions
Our findings suggest that DNA methylation status at the SORT1 promoter CpG site may be a potential biomarker for MMD.
Introduction
Moyamoya disease (MMD) is characterized by progressive bilateral occlusion of the terminal portion of the internal carotid arteries or the proximal portion of the anterior cerebral arteries and the middle cerebral arteries, and by the development of fine collateral networks near the stenotic lesions [1,2]. While magnetic resonance imaging/angiography (MRI/MRA) are reliable tools for the diagnosis of MMD, cerebral angiography is the gold standard test. However, these imaging tools are either costly or invasive and are often not suitable for use in screening or follow-up applications. This is especially true for pediatric patients, who require sedation even for MRI/MRA. Furthermore, the complication risk associated with repeated puncture of the femoral arteries in children is not negligible. Therefore, the development of a noninvasive low-cost screening methods may aid in the clinical identification of MMD. The patient’s family members may be screened first before follow-up with expensive invasive work-ups. Treated patients will, thus, require a reduced number of MRI/MRA or angiography assessments during the follow-up period.
Considering this background, research has focused on the identification of a biomarker for MMD, with recent molecular studies having suggested novel biomarker candidates in the serum and cerebrospinal fluid (CSF) of patients with MMD. Studies have also revealed differential plasma concentrations of various growth factors, cytokines, and angiogenic factors in patients with MMD compared with healthy controls. A study reported significantly elevated plasma concentrations of matrix metalloproteinase 9 (MMP-9), monocyte chemoattractant protein-1, interleukin-1β, vascular endothelial growth factor (VEGF), and platelet-derived growth factor subunit B but lower plasma concentrations of MMP-3 and tissue inhibitors of metalloproteinase (TIMP)-1 and -2 in patients with MMD compared with the healthy controls [3]. Furthermore, serum microRNA let-7c, alpha-1-antitrypsin, and MMP-9 may serve as potential biomarkers for MMD diagnosis [4-6]. CSF cellular retinoic acid-binding protein-I, basic fibroblast growth factor (FGF), soluble vascular cell adhesion molecule 1, intercellular adhesion molecule 1, and E-selectin levels may also serve as MMD biomarkers [7-9].
Specific characteristics of circulating endothelial progenitor cells (EPCs) and smooth muscle progenitor cells (SPCs) may serve as potential biomarkers for MMD. For instance, a prior study reported high serum levels of circulating stromal cell-derived factor-1α and cluster of differentiation 34 (CD34)+/ C-X-C chemokine receptor type 4 (CXCR-4)+-EPCs in adult patients with MMD [10]. In contrast, another study reported decreased levels of circulating EPCs in patients with MMD compared to the healthy controls [11]. In addition, increased expression of genes involved in cell adhesion, cell migration, immune response, and vascular development, such as integrin α3, brain-specific angiogenesis inhibitor 1 (BAI1)-associated protein 2-like 1, N-cadherin, ephrin (Eph) receptor A5, and melanoma cell adhesion molecule, have been detected in SPCs from patients with MMD [12]. In recent genetic studies, ring finger protein 213 (RNF213) was also identified as an important MMD susceptibility gene in East Asian populations [13]. An RNF213 variant (c.14576G>A) was present in 95% of the familial MMD cases and 79% of the sporadic MMD cases. Additionally, this variant was strongly associated with early-onset and more severe forms of MMD, suggesting its use as a prognostic biomarker. However, the gene’s function remains unconfirmed [13]. Although several specific biomarkers have been suggested for MMD diagnosis and prognosis, to date, none have found utility in clinical practice.
Here, we investigated aberrant genome-wide CpG methylation patterns in endothelial colony forming cells (ECFCs) in patients with MMD compared to the healthy controls. To identify epigenetic biomarkers for MMD diagnosis, we further integrated CpG methylation and mRNA expression profiles to identify genes whose expression was regulated by DNA methylationdependent transcriptional modification. We observed that the expression of sortilin 1 (SORT1) was upregulated via hypomethylation of a specific CpG site in its promoter. Furthermore, the DNA methylation status at the specific promoter CpG site on SORT1 in ECFCs readily distinguished patients with MMD from normal controls with high accuracy. We propose that the DNA methylation status at a particular SORT1 promoter CpG site may be a biomarker for MMD.
Methods
Study subjects
Blood samples from patients with MMD and healthy controls were collected after informed consent was obtained from all participants according to a protocol approved by Seoul National University Hospital’s Institutional Review Board (IRB) of (SNUH IRB 1404-006-567). All patients with MMD were diagnosed via cerebral angiography. For ethical reasons, recruitment of agematched controls was not possible; therefore, young adults with no history of stroke, hypertension, or smoking were chosen. Samples from 18 patients with MMD and 16 normal controls were used in the present study. We collected patient information, including sex, age, symptoms, Suzuki grade, and infarct specifics. The clinical characteristics of patients with MMD are summarized in the Supplementary Table 1.
Isolation and characterization of ECFCs
The procedures for buffy coat preparation and mononuclear cell (MNC) culture priming towards an ECFC lineage have been described previously [14]. All blood samples (40 mL) were processed within 2 hours after collection. The MNCs were plated on culture dishes coated with collagen type I (BD BioCoat, BD Biosciences, Mountain View, CA, USA) in an endothelial cell growth medium (EGM-2, Clonetics, San Diego, CA, USA) with 10% fetal bovine serum (FBS). ECFCs were characterized by fluorescence-activated cell sorting (FACS) analysis and immunofluorescence staining using antibodies against CD34, kinase insert domain receptor (KDR), CD133, CD31, CD45, and von willebrand factor (vWF). For flow cytometry analyses, 1×10⁶ cells were incubated for staining with 10 μL each of phycoerythrin conjugated anti-human CD34 (BD Biosciences: Catalog #555822), KDR (R&D, Minneapolis, MN, USA: Catalog #FAB357P), CD133 (Miltenyi biotec, Bergisch Gladbach, Germany: Catalog #130-080-801), CD31 (BD Biosciences: Catalog #560983), and CD45 (BD Biosciences: Catalog #560975) antibodies. Resultant FACS data were analyzed using a FACScan flow cytometer (Becton Dickinson, Franklin Lakes, NJ, USA) and CellQuest software (Becton Dickinson). Immunofluorescent staining was performed using anti-CD31 (Santa Cruz Biotechnology, Dallas, TX, USA: Catalog #sc-1506) and anti-vWF (DAKO, Glostrup, Denmark: Catalog #M0616) antibodies.
Cell culture
Before human umbilical vein endothelial cells (HUVECs) isolation, written informed consent was obtained from each participant who donated an umbilical cord sample. The Ewha Womans University Mokdong Hospital IRB approved this study. HUVECs were isolated from fresh newborn umbilical cord veins by collagenase digestion using a standard protocol, as described previously [15]. HUVECs were grown in Medium 200 supplemented with low serum growth supplements, 10% FBS, and antibiotic-antimycotic (Gibco-BRL, Gaithersburg, MD, USA) at 37°C with 5% CO2 in a humidified atmosphere. All experiments were conducted between the fourth and sixth cell passages.
Total RNA isolation and mRNA microarray
Total RNA was extracted from cultured cells using the RNeasy mini kit (Qiagen, Valencia, CA, USA) and amplified and labeled according to the Affymetrix GeneChip Whole Transcript Sense Target Labeling protocol (Thermo Fisher Scientific, Waltham, MA, USA). The resulting labeled complementary DNA (cDNA) was hybridized to Affymetrix Human Gene 2.0 ST Arrays (Thermo Fisher Scientific). Scanned raw expression values were background-corrected, normalized, and summarized using the Robust Multiarray Averaging approach in the Bioconductor “affy” package (Bioconductor, http://www.bioconductor.org). The resulting log2-transformed data were used for further analyses. To identify differentially expressed genes (DEGs), we used moderated t-statistics based on an empirical Bayesian approach [16]. DEGs were defined as genes having expression levels in MMD samples that differed by at least a 1.5-fold (|fold change (FC)| >1.5) when compared with normal samples (P<0.05).
Genomic DNA isolation and CpG methylation microarray
Genomic DNA was extracted from ECFCs using the QIAmp mini kit (Qiagen) according to the manufacturer’s instructions. For genome-wide screening of DNA methylation, the Illumina HumanMethylation450 BeadChip (Illumina, San Diego, CA, USA) platform was used, which targets 450,000 specific CpG sites. To adjust for probe design bias, β-values were normalized based on the Beta Mixture Quantile method [17]. Differentially methylated CpG sites were identified by moderated t-statistics [16]. A differentially methylated CpG site was defined as having an average β-value that was significantly different in MMD samples compared to normal samples (P<0.05 and |Δβ| >0.2). We considered a CpG site as hypermethylated if Δβ was greater than 0.2 and as hypomethylated if Δβ was less than –0.2.
Reverse transcription-quantitative polymerase chain reaction
One microgram of total RNA was converted to cDNA using Superscript II reverse transcriptase and oligo-(dT)12-18 primers (both from Thermo Fisher Scientific) according to the manufacturer’s instructions. Reverse transcription-quantitative polymerase chain reaction (RT-qPCR) was performed using a 20-μL reaction mixture containing 1 μL cDNA, 10 μL SYBR Premix EX Taq (Takara Bio, Otsu, Japan), 0.4 μL 50× Rox reference dye (Takara Bio), and 200 nM of gene-specific primers. The primer sequences used in this study are listed in the Supplementary Table 2. The reactions were run on a 7500 Fast Real-Time PCR System (Thermo Fisher Scientific) at 95°C for 30 seconds, followed by 40 cycles of 95°C for 3 seconds and 60°C for 30 seconds and a single dissociation cycle of 95°C for 15 seconds, 60°C for 60 seconds, and 95°C for 15 seconds. All reactions were performed in triplicate, and the specificity of the reaction was determined using melting curve analyses at the dissociation stage. Comparative quantification of each target gene was performed based on the cycle threshold normalized to glyceraldehyde 3-phosphate dehydrogenase threshold using the 2-ΔΔCt method.
Bisulfite sequencing PCR
Treatment of the extracted genomic DNA from ECFCs with bisulfite converts unmethylated cytosines but not methylated cytosines to uracils, allowing for the distinction between unmethylated and methylated cytosines. DNA modification using bisulfite was performed using an EpiTech Bisulfite Kit (Qiagen) according to the manufacturer’s instructions.
We performed bisulfite sequencing PCR (BSP) using conventional PCR in a 50 μL reaction mixture containing 10 ng of bisulfite-modified genomic DNA, 1.5 mM MgCl2, 200 μM deoxynucleotide triphosphate, 1 U Platinum Taq polymerase (Thermo Fisher Scientific), 1×Platinum Taq buffer, and 200 nM specific BSP forward and reverse primers for each gene. BSP primers were designed using MethPrimer software (http://www.urogene.org/methprimer) (listed in Supplementary Table 3). The reaction ran at 95°C for 5 minutes followed by 30 cycles of 95°C for 30 seconds, 50°C to 55°C for 30 seconds, and 72°C for 30 seconds, and a final 72°C elongation step for 5 minutes. BSP products were purified using the QIAquick Gel Extraction kit (Qiagen), per the manufacturer’s protocol, and ligated into a pGEM-T Easy cloning vector (Promega, Fitchburg, WI, USA). Ligation products were used to transform competent DH5α Escherichia coli cells (RBC Bioscience, New Taipei City, Taiwan) using standard procedures. Blue/white screening was used to select bacterial clones, and BSP product-positive clones were confirmed by colony PCR using BSP primers to verify insert size. Plasmid DNA was then extracted from at least 10 insert-positive clones using the QIAprep Spin Miniprep Kit (Qiagen) and sequenced using M13 primers to analyze methylation status at specific CpG sites.
5-aza-2’-deoxycytidine treatment
ECFCs from normal control N1 were treated with the methylation inhibitor 5-aza-2’-deoxycytidine (Sigma-Aldrich, Darmstadt, Germany), which was replaced daily at various concentrations (0, 10, and 20 μM) for 3 days.
Pyrosequencing for DNA methylation analyses
We used bisulfite pyrosequencing for methylation analyses of target promoter regions. Each primer was designed using the PSQ assay design program (Qiagen) (sequences are listed in Supplementary Table 4). PCR reactions were performed in a volume of 20 μL with 20 ng or less of bisulfite-converted gDNA, 10 μL 2×Hot/Start PCR premix (Enzynomics, Daejeon, Korea), 1 μL forward primer (10 pmole/μL), and 1 μL biotinylated-reverse primer (10 pmole/μL). Amplifications were performed according to general pyrosequencing guidelines involving denaturing at 95°C for 10 minutes, followed by 50 cycles at 95°C for 30 seconds, 56°C for 30 seconds, 72°C for 30 seconds, and a final extension of 72°C for 10 minutes. The PCR reaction (2 μL) was confirmed by electrophoresis in a 2.5% agarose gel and visualized by ethidium bromide staining.
The ssDNA template was prepared from 16 to 18 μL of biotinylated PCR product using streptavidin Sepharose HP beads (Amersham Biosciences, Piscataway, NJ, USA), following the PSQ 96 sample preparation guide. Sequencing primers (15 pM) were then added for analyses. Sequencing was performed on a PyroMark ID system using the Pyro Gold reagent kit (Biotage, Uppsala, Sweden), per manufacturer’s instructions. The analyzed sequences are listed in Supplementary Table 4.
HUVEC transfection
HUVECs were transfected with an enhanced green fluorescent protein (EGFP) or SORT1 expression construct using the Amaxa HUVEC Nucleofector kit (Lonza, Basel, Switzerland). Briefly, cells grown to 80% to 90% confluence were trypsinized and pelleted, and 5×10⁵ cells were resuspended with 2.0 μg of plasmid DNA (pCMV6-XL5-SORT1, Origene, Rockville, MD, USA) or pmaxGFP vector and 100 μL of Nucleofector solution in a Nucleofection cuvette, using program U001. We then added 500 μL of complete growth media and suspended the cells for 24 hours. Overexpression of SORT1 was confirmed by RT-qPCR 24 hours after transfection.
Pre-designed small interfering RNA (siRNA) against SORT1 (si-SORT1, CAT#ID L-010620-00-0005) and a non-targeting control siRNA (siNC, CAT#ID D-001810-10-05) were purchased from Thermo Fisher Scientific. To deplete endogenous SORT1 expression, HUVEC were transfected with 100 nM siSORT1 or siNC using DharmaFECT 4 transfection reagent (Thermo Fisher Scientific) according to the manufacturer’s protocol. Knockdown of SORT1 mRNA was confirmed by RT-qPCR 24-hour post-transfection.
Tube formation
Tube formation was assessed via Matrigel assay. Basement membrane matrix Matrigel was purchased from BD Biosciences (Billerica, MA, USA). Matrigel was thawed on ice overnight and spread evenly over each well (300 μL) of a 24-well plate. Plates were then incubated for 1 hour at 37°C to allow the Matrigel to polymerize. Expression construct-transfected HUVECs were seeded at 4×10⁴ cells per well on a Matrigel-coated 24-well plate and grown in 300 μL of complete growth media for 16 hours in a humidified 37°C, 5% CO2 incubator.
To determine the effect(s) of knockdown of endogenous SORT1 on tube formation, HUVECs transfected with either siSORT1 or siNC were cultured for 24 hours and then starved for 8 hours with Medium 200. After starvation, siRNA-transfected HUVECs were plated at 1×10⁵ cells per well on a Matrigel-coated 24-well plate using growth factor reduced Matrigel matrix (BD Biosciences) and grown for 6 hours to induce tube networking.
Tube-like structures were observed using a light microscope and camera at 40×magnification. Tube length was measured in six randomly selected fields per well and quantified by Image J software (http://rsb.info.nih.gov/ij/index.html).
RNF213 gene sequencing
DNA samples were obtained from ECFCs using the DNA Mini kit (Thermo Fisher Scientific), per manufacturer instructions. After DNA extraction and quantification, DNA samples were subjected to PCR amplification with the appropriate primer sets (sense 5′-CTGATGCGTCAGCTCCATAG-3′ and antisense 5′-TTCCTGCTTTGTGCAGTCAC-3′). Sequencing analysis of the RNF213 c.14576G>A variant was conducted using a ABI 3730XL DNA sequencer, and data were analyzed by ABI sequencing analysis software (Thermo Fisher Scientific).
Statistical analyses
All data are expressed as the mean±standard deviation (SD) of at least three independent experiments. Statistical analyses were done using GraphPad Prism 5 software (GraphPad Software Inc, La Jolla, CA, USA). Details of each analysis are provided in the figure legends. P-values <0.05 were considered statistically significant.
Results
Selection of MMD-associated genes using integrated analysis
We performed expression microarray and DNA methylation microarray analyses in ECFCs from three patients with MMD (MMD1, MMD2, MMD3) and two normal controls (N1, N2), then selected DEGs and differentially methylated promoter CpG sites. To identify genes with differential expression that might be ascribed to changes in promoter CpG methylation, DNA methylation profiling data was integrated with mRNA expression profiling data using the following selection criteria: upregulated (FC >1.5) by hypomethylation (Δβ <–0.2) at promoter CpG sites and downregulated (FC >1.5) by hypermethylation (Δβ >0.2) at promoter CpG sites in ECFCs from patients with MMD compared to normal control ECFCs. Using these criteria, five candidate genes were selected. All five genes were upregulated via promoter CpG hypomethylation (Table 1).

Differentially expressed genes with differentially methylated CpG sites in endothelial colony forming cells from patients with moyamoya disease
Candidate gene expression was upregulated in ECFCs from patients with MMD
mRNA of the five candidate genes were validated by RT-qPCR. Expression of all five genes were increased in the ECFCs of the three patients with MMD compared to those of the two controls (Figure 1).
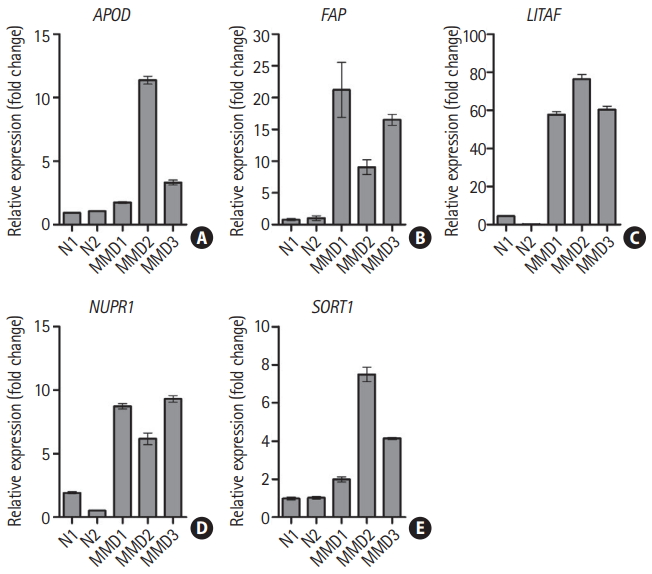
Upregulation of five candidate genes in endothelial colony forming cells from patients with moyamoya disease (MMD). mRNA expression for five candidate genes was determined by reverse transcription-quantitative polymerase chain reaction. Data are represented as the mean±standard deviation of three experiments. (A) Apolipoprotein D (APOD), (B) fibroblast activation protein alpha (FAP), (C) lipopolysacchride induced tumor necrosis factor-alpha factor (LITAF), (D) nuclear protein 1 (NUPR1), and (E) sortilin 1 (SORT1). N, normal control.
Candidate gene expression was regulated by DNA methylation
Apolipoprotein D (APOD) promoter CpG sites (human GRCh38/hg38 assembly position 195,583,895–195,583,362, chromosome 3)—especially the first through the fourth CpGs—were hypomethylated in ECFCs from all three patients with MMD relative to those from the two normal controls. Six out of seven CpG sites in the fibroblast activation protein alpha (FAP) promoter region (162,243,202–162,243,697, chromosome 2) were hypomethylated in ECFCs from patients with MMD. Lipopolysacchride induced tumor necrosis factor-alpha factor (LITAF) promoter region (11,587,448–11,587,875 of chromosome 16) CpG sites (especially the fourth and fifth) were mainly hypomethylated in ECFCs from patients with MMD. Obvious hypomethylation was observed at the fifth CpG site within the nuclear protein 1 (NUPR1) promoter region located at 28,538,953–28,539,381 of chromosome 16. In the SORT1 promoter region (109,398,372–109,398,816 of chromosome 1), which contains 11 CpG sites, the eighth CpG site was unmethylated in ECFCs from all three patients with MMD while it was heavily methylated in ECFCs from normal controls (Figure 2). These results are consistent with the results of our DNA methylation microarray.
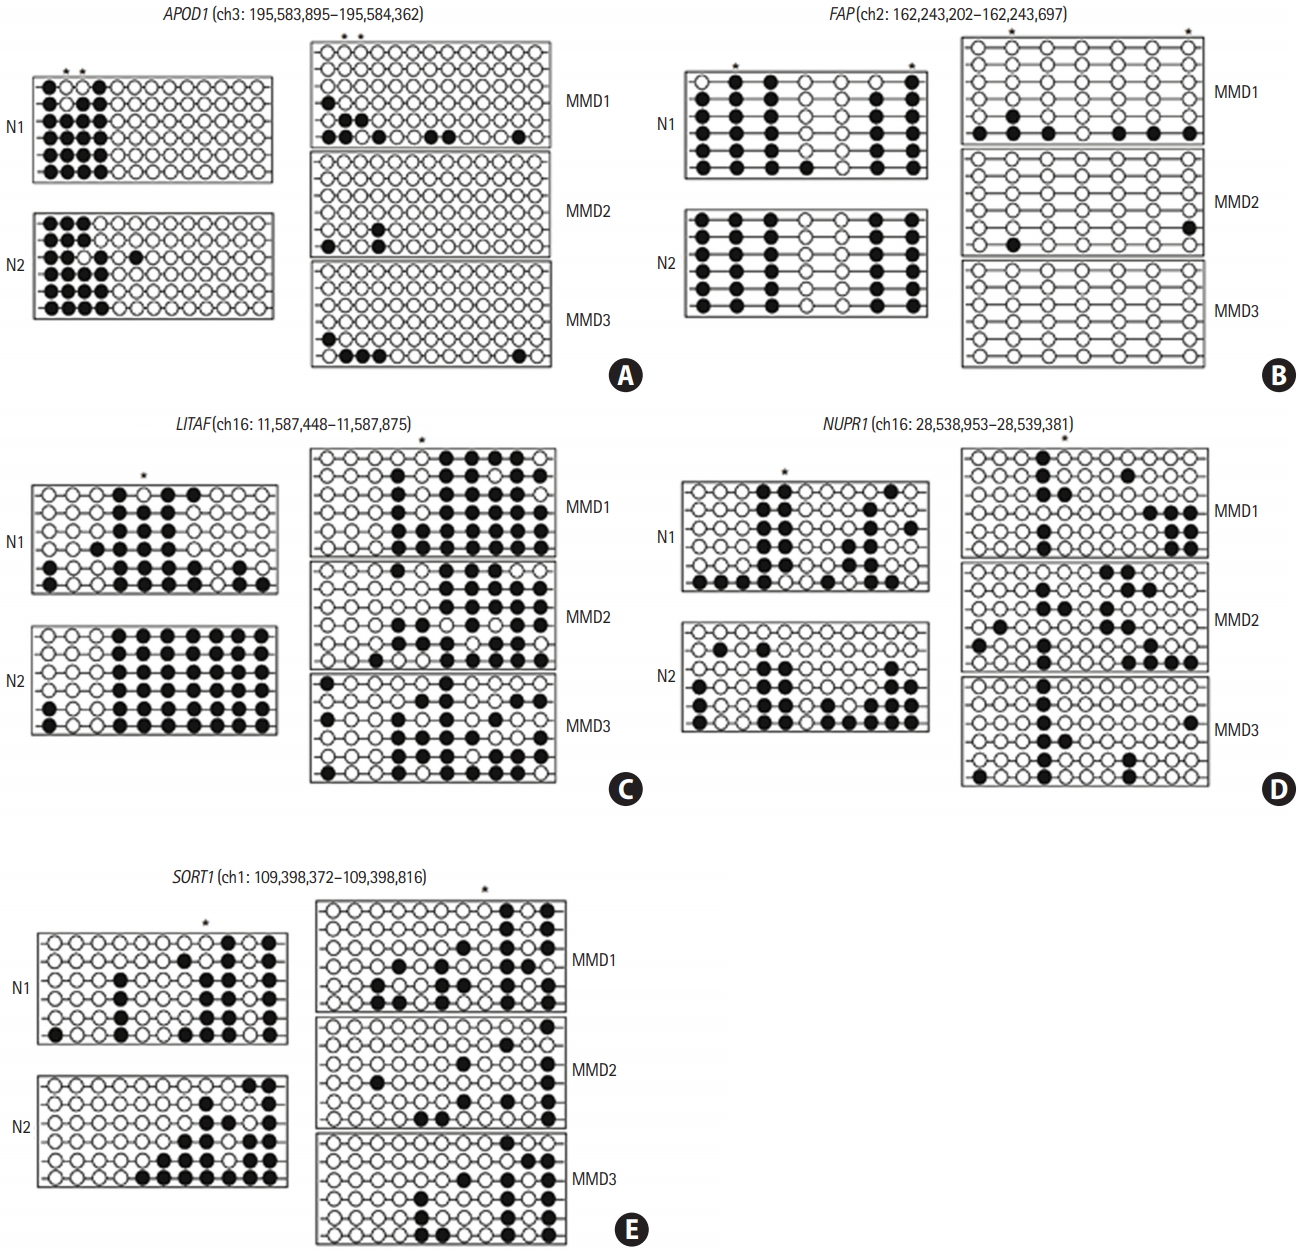
Promoter CpG sites in the five candidate genes were hypomethylated in endothelial colony forming cells (ECFCs) from patients with moyamoya disease (MMD). The DNA methylation status within the promoter region was analyzed using bisulfite sequencing polymerase chain reaction. Each circle represents CpG dinucleotides. The methylation status of each CpG site is denoted by black (methylated) or white (unmethylated) circles. Stars above the circles indicate the differentially methylated CpG sites in ECFCs, as revealed by DNA methylation microarray analysis. (A) Apolipoprotein D (APOD), (B) fibroblast activation protein alpha (FAP), (C) lipopolysacchride induced tumor necrosis factor-alpha factor (LITAF), (D) nuclear protein 1 (NUPR1), and (E) sortilin 1 (SORT1). N, normal control.
After ECFCs from a normal control (N1) were treated with 5-aza-dC, a DNA methyltransferase inhibitor, transcriptional expression of all five candidate genes was significantly increased (Figure 3). mRNA expression of FAP and SORT1 was upregulated approximately two-fold when cells were treated with 20 μM of 5-aza-dC. These results indicate that transcriptional expression of the five candidate genes was epigenetically regulated by DNA methylation.

Transcriptional expression of the five candidate genes altered by a DNA methyltransferase inhibitor. Endothelial colony forming cells from normal control N1 were treated with 0, 10, and 20 μM 5-aza-2′-deoxycytidine for 3 days. After treatment with 5-aza-2′-deoxycytidine, mRNA expression was determined by reverse transcription-quantitative polymerase chain reaction. Data are represented as mean±standard deviation (n=3). Statistical analyses were performed using a one-way analysis of variance and Dunnett’s multiple comparison post-tests for comparing treated and untreated cells. (A) Apolipoprotein D (APOD), (B) fibroblast activation protein alpha (FAP), (C) lipopolysacchride induced tumor necrosis factor-alpha factor (LITAF), (D) nuclear protein 1 (NUPR1), and (E) sortilin 1 (SORT1). N, normal control. *P<0.05; † P<0.001.
SORT1 promoter CpG site was hypomethylated in patients with MMD
We investigated the mRNA expression levels of five candidate genes in ECFCs from nine patients with MMD and 10 normal controls for further validation of our previous results. Only SORT1 mRNA expression was significantly upregulated in ECFCs from patients with MMD compared to those of normal controls (Figure 4). However, we only had a 48% detection power (at P=0.05) for detecting a significant mean difference in SORT1 mRNA expression between the two groups. This indicates that the sample size used for these an alysis was not sufficient to detect MMDrelated differences (Supplementary Figure 1A).
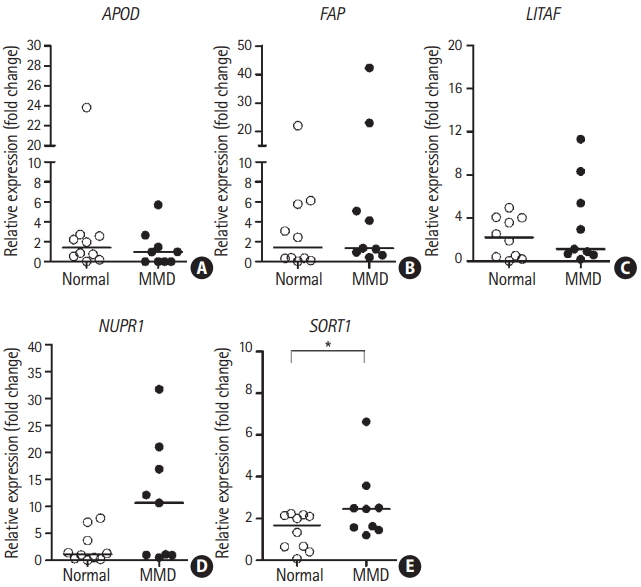
mRNA expression of sortilin 1 (SORT1) was upregulated in patients with moyamoya disease (MMD). mRNA expression of the five candidate genes in endothelial colony forming cells was determined via reverse transcription-quantitative polymerase chain reaction for nine patients with MMD and ten controls. The lines inside the graphs represent medians. Statistical analyses were performed using the Mann-Whitney U test. (A) Apolipoprotein D (APOD), (B) fibroblast activation protein alpha (FAP), (C) lipopolysacchride induced tumor necrosis factor-alpha factor (LITAF), (D) nuclear protein 1 (NUPR1), and (E) SORT1. *P<0.05.
We further examined the DNA methylation status of specific promoter CpG sites for five candidate genes in ECFCs from eight patients with MMD and eight normal controls using pyrosequencing (specific CpGs are listed in Supplementary Table 4). Among the five candidate genes, only the specific promoter CpG site on SORT1 was significantly hypomethylated in ECFCs from patients with MMD versus controls (Figure 5A). The power of detecting a significant mean difference in methylation at specific promoter CpG site on SORT1 between two groups with significance level of 0.05 was 93%. This indicates that the sample size used for the analysis offered sufficient power to detect differences between controls and patients with MMD (Supplementary Figure 1B).

Evaluation of DNA methylation status at a specific sortilin 1 (SORT1) promoter CpG site as an moyamoya disease (MMD) biomarker. (A) DNA methylation status at the specific promoter CpG sites for five candidate genes was determined using pyrosequencing analysis of endothelial colony forming cells (ECFCs) from eight patients with MMD and eight normal controls. Lines inside graphs represent medians. Statistical analyses were performed using the Mann-Whitney U test. DNA methylation status at specific SORT1 CpG sites was determined using ECFC pyrosequencing analysis from an independent sample set of patients with MMD (n=7) and normal controls (n=6). (B) Receiver operating characteristic curves reveal discrimination of patients with MMD from normal controls based on DNA methylation status at a specific SORT1 promoter CpG site. APOD, apolipoprotein D; FAP, fibroblast activation protein alpha; LITAF, lipopolysacchride induced tumor necrosis factor-alpha factor; NUPR1, nuclear protein 1; AUC, area under the curve. *P<0.01.
We next evaluated whether MMD can be predicted by DNA methylation status at a specific SORT1 promoter CpG site using a logistic regression model in a set of independent MMD samples (n=7) and controls (n=6). The sample size used for this analysis offered sufficient power (89%) to detect differences between normal controls and patients with MMD (Supplementary Figure 1C). A receiver operating characteristic curve analysis revealed good separation of patients with MMD from normal controls with a sensitivity of 83.33% and a specificity of 100% (Figure 5B). The area under the curve was 0.9762 (P=0.004292). These results suggest that the DNA methylation status at a specific promoter CpG site on the SORT1 is a potential biomarker for MMD.
SORT1 -inhibited HUVEC tube formation
To elucidate the functional role of SORT1 in angiogenesis, a SORT1 expression plasmid construct was transiently transfected into HUVECs. HUVEC tube formation was then evaluated using a Matrigel assay. After a 24-hour transfection, overexpression of SORT1 was confirmed by RT-qPCR (Supplementary Figure 2). At 16-hour of tube formation, overexpression of SORT1 suppressed tube length by 70%±10.71% compared to the mock transfected controls (Figure 6A).
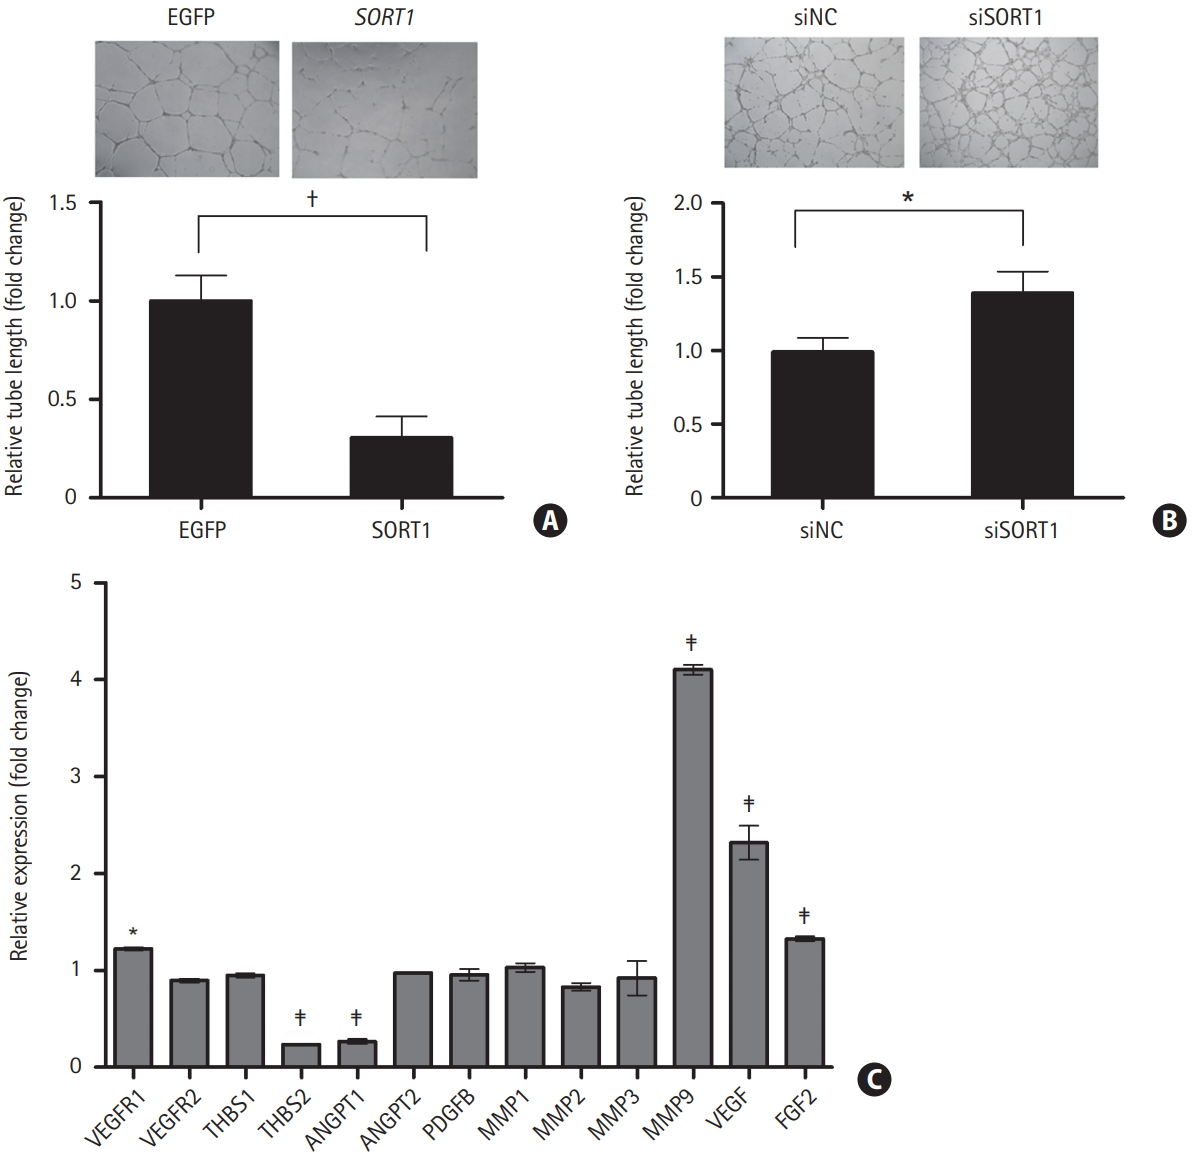
Overexpression of sortilin 1 (SORT1) suppressed human umbilical vein endothelial cell (HUVEC) tube formation. Representative images show tube formation in mock transfected and SORT1-transfected (A, upper panel) or non-targeting control siRNA (siNC) and SORT1 siRNA (siSORT1)-transfected (B, upper panel) HUVECs. Tube length was quantified by Image J software using pictures of tube formation (n=6; A and B, lower panel). (C) Comparisons were made via t-tests. mRNA expression of major angiogenic factors and matrix metalloproteinases (MMPs) was determined by reverse transcription-quantitative polymerase chain reaction in mock transfected and SORT1-transfected HUVECs. Data are shown as mean±standard deviation (n=3). A one-way analysis of variance and Dunnett’s multiple comparison post-tests were used to compare mock and SORT1-transfected HUVECs. EGFP, enhanced green fluorescent protein; VEGFR, vascular endothelial growth factor receptor; THBS, thrombospodin; ANGPT, angiopoietin; PDGFB, platelet-derived growth factor subunit B; VEGF, vascular endothelial growth factor; FGF2, fibroblast growth factor 2. *P<0.05; † P<0.01; ‡ P<0.001.
We further explored how SORT1 expression affects HUVEC tube formation using siRNA-induced SORT1 knockdown. After a 24-hour transfection, knockdown of endogenous SORT1 expression was confirmed by RT-qPCR. The expression of SORT1 mRNA was reduced by 59%±4.25% in siSORT1-transfected HUVECs versus siNC-mock transfected cells (Supplementary Figure 2). Knockdown of SORT1 expression induced a significant increase (39%±14.76%) in tube length in HUVECs versus mock transfected controls (Figure 6B).
Finally, we investigated the effect of SORT1 on major angiogenic factor and MMP expression by RT-qPCR in SORT1-overexpressing HUVECs. Expression of MMP9, VEGF, vascular endothelial growth factor receptor 1 (VEGFR1), and FGF2 were significantly increased, while expression of thrombospondin 2 (THBS2) and angiopoietin 1 (ANGPT1) was reduced by approximately 74% and 76%, respectively, in SORT1-transfected HUVECs versus mock transfected controls (Figure 6C). These results indicate that SORT1 overexpression suppressed the angiogenic potential of endothelial cells by modulating their expression of major angiogenic factors and MMPs.
Discussion
The pathogenesis of MMD still remains poorly understood and no reliable molecular biomarkers for MMD have been identified to date. DNA methylation is a major epigenetic mechanism, with alterations reflecting the pathological development of various diseases such as cancer, neurodegenerative disease, and autoimmune disease [18]. Alterations in DNA methylation have recently emerged as biomarkers for the detection and/or diagnosis of various diseases due to their stability, frequency, and noninvasive accessibility via bodily fluids such as blood, urine, and CSF [19].
Here, we performed an integrated analysis of gene expression and DNA methylation profiles to identify genes associated with MMD using ECFCs from three patients with MMD and two normal controls. Five genes (APOD, FAP, LITAF, NUPR1, SORT1) were selected in an initial evaluation, expression of which was upregulated by hypomethylation of specific promoter CpG sites. The DNA methylation-dependent transcriptional regulation of the five candidate genes was confirmed by treatment with a DNA methyltransferase inhibitor. Transcriptional expression of these five genes was significantly increased after treatment with 5-aza-2’-deoxycytidine. The differential mRNA expression and DNA methylation status at specific promoter CpG sites for these five genes in ECFCs from patients with MMD and normal controls was further validated in an expanded sample of patients with MMD and normal controls. The statistically significant upregulation of mRNA expression and hypomethylation at specific promoter CpG sites was only observed in SORT1, which was also used to readily and accurately distinguished patients with MMD from normal controls (receiver operating characteristic area under the curve 0.98, sensitivity 83.3%, specificity 100%). This was evaluated in an independent sample set of patients with MMD (n=7) and normal controls (n=6) using a logistic regression model.
The SORT1 gene within the 1p13.3 locus of chromosome 1 encodes the protein sortilin, which is one of five members of the mammalian vacuolar protein sorting 10 protein (VPS10P) domain receptor family. It is produced in the endoplasmic reticulum as a precursor protein harboring a 44-amino acid propeptide, and proteolytically processed by furin-mediated cleavage to generate the mature form of the receptor in late Golgi compartment. This receptor is involved in the trafficking of a wide variety of intracellular proteins to either the cell surface or subcellular compartments, such as endosomes and lysosomes, to mediate endocytosis and lysosomal degradation [20]. Recently, sortilin was reported to be an important modulator of lipid metabolism and atherogenesis. Prior studies on the overexpression or deficiency of sortilin in atherosclerotic mouse models suggested that sortilin strongly affects plasma cholesterol levels and the development of atherosclerosis, though its role in the export of hepatic lipoproteins remains controversial. A study reported that an absence of sortilin in an atherosclerotic mouse model resulted in decreased plasma low density lipoprotein cholesterol (LDL-C) levels and aortic atherosclerotic lesions, indicating that sortilin is involved in lipid metabolism and atherosclerosis [21]. Other studies have reported that sortilin knockdown in the mouse liver increases plasma cholesterol levels [22,23]. Human genome-wide association studies have also shown that overexpression of SORT1 leads to decreased plasma LDL-C levels and deficiency of SORT1 results in increased plasma cholesterol levels [24,25].
Further studies are required to determine the regulatory mechanisms of sortilin in lipid metabolism; sortilin also acts as a neurotransmitter receptor to regulate pro-nerve growth factor (proNGF)-induced neuronal viability and function [26]. Increasing evidence suggests that sortilin is closely associated with neurodegenerative processes via control of proNGF-induced neuronal death [27] and alterations to amyloid precursor protein processing caused by β-secretase trafficking, as in Alzheimer’s disease [28]. Sortilin may perform more functions in different cell-types and tissues. Here, we demonstrate that sortilin is involved in angiogenesis.
Our results show that overexpression of SORT1 suppressed endothelial cell tube formation by modulating the expression of angiogenic factors and MMP9. The expression of pro-angiogenic factors (e.g., VEGF, VEGFR1, and FGF2) was increased, whereas the expression of ANGPT1, which is involved in maturation and stabilization of the developing vasculature by interaction with Tie2 receptor [29], was significantly decreased by the overexpression of SORT1. In addition to pro-angiogenic factors, the expression of THBS2, an endogenous inhibitor of angiogenesis [30], decreased, while MMP9 expression markedly increased on overexpression of SORT1.
MMP9 promotes angiogenesis by releasing and activating growth factors and cytokines, but also inhibits angiogenesis by generating angiogenic inhibitors, such as angiostatin, and cleaving angiogenic factors [31]. Angiogenesis is a complex process that involves a dynamic interplay between a multitude of pro- and anti-angiogenic factors. The expressional modulation of angiogenic factors by SORT1 may contribute to abnormal blood vessel development by perturbing the delicate balance between pro- and anti-angiogenic factors. We previously reported increased MMP9 levels in combination with VEGF in plasma from patients with MMD; these may contribute to the intimal hyperplasia and formation of collateral vessels observed in MMD pathology [3]. Previous studies have also shown elevated levels of FGF2 in the CSF, superficial temporal arteries, and dura mater of patients with MMD, demonstrating that FGF2 may play a major role in the pathogenesis of MMD [8,32]. Although the precise mechanisms underlying SORT1 modulation of major angiogenic factor expression require further investigation, these results suggest that aberrant overexpression of SORT1, mediated by DNA methylation-dependent transcriptional regulation, contributes to the pathogenesis of MMD.
Conclusions
Our findings suggest that the DNA methylation status of a specific SORT1 promoter CpG site in ECFCs may serve as a reliable, noninvasive biomarker for MMD.
Supplementary materials
Supplementary materials related to this article can be found online at https://doi.org/10.5853/jos.2018.00962.
Demographic information of moyamoya disease patients and normal controls
List of primers used for reverse-transcription quantitative polymerase chain reaction
List of primers used for bisulfite sequencing polymerase chain reaction
List of primers used for pyrosequencing analyses
The power of detecting a significant mean difference in methylation or mRNA expression of sortilin 1 (SORT1) gene between normal control and moyamoya disease (MMD) groups. To calculate the power to detect a meaningful difference in a given sample size, a post hoc power analysis was performed with G*power 3.1 software (Heinrich-Heine-University Düsseldorf) using a two-tailed test with the significance level of 0.05, per convention. (A) A sample set with normal controls (n=10) and MMD patients (n=8) was used for validation of SORT1 mRNA expression in endothelial colony forming cells (ECFCs). (B) A sample set with normal controls (n=8) and MMD patients (n=8) was used for validation of methylation status in the SORT1 promoter in ECFCs. (C) A sample set with normal controls (n=6) and MMD patients (n=7) was used for further validation of methylation status of the SORT1 promoter in ECFCs.
Ectopic expression of sortilin 1 (SORT1) mRNA was confirmed by reverse transcription-quantitative polymerase chain reaction (RT-qPCR) following transient transfection. Human umbilical vein endothelial cells were transiently transfected with a pmaxGFP vector and pCMV6-XL5-SORT1 expression construct or with non-targeting control siRNA (siNC) and SORT1 siRNA (siSORT1). Overexpression (A) or depletion (B) of SORT1 mRNA was confirmed via RT-qPCR after a 24-hour transfection. Data are represented as mean±standard deviations for the three independent experiments. Statistical differences were determined via t-test. GFP, green fluorescent protein. *P<0.001.
Notes
Disclosure
The authors have no financial conflicts of interest.
Acknowledgements
This research was supported by a grant from the Korea Health Technology R&D Project through the Korea Health Industry Development Institute (KHIDI), funded by the Ministry of Health and Welfare, Republic of Korea (grant number: HI12C0066) and by the National Research Foundation of Korea (NRF) Basic Science Research Program, funded by the Ministry of Science, ICT & Future Planning (2010-0027945).