J Stroke Search

CLOSE


J Stroke > Volume 20(3); 2018 > Article
Pikija, Trkulja, Ramesmayer, Mutzenbach, Killer-Oberpfalzer, Hecker, Bubel, Füssel, and Sellner: Higher Blood Pressure during Endovascular Thrombectomy in Anterior Circulation Stroke Is Associated with Better Outcomes

Abstract

Background and Purpose

Reports investigating the relationship between in-procedure blood pressure (BP) and outcomes in patients undergoing endovascular thrombectomy (EVT) due to anterior circulation stroke are sparse and contradictory.

Methods

Consecutive EVT-treated adults (modern stent retrievers, BP managed in line with the recommendations, general anesthesia, invasive BP measurements) were evaluated for associations of the rate of in-procedure systolic BP (SBP) and mean arterial pressure (MAP) excursions to >120%/<80% of the reference values (serial measurements at anesthesia induction) and of the reference BP/weighted in-procedure mean BP with post-procedure imaging outcomes (ischemic lesion volume [ILV], hemorrhages) and 3-month functional outcome (modified Rankin Scale [mRS], score 0 to 2 vs. 3 to 6).

Results

Overall 164 patients (70.7% pharmacological reperfusion, 80.5% with good collaterals, 73.8% with successful reperfusion) were evaluated for ILV (range, 0 to 581 cm3) and hemorrhages (incidence 17.7%). Higher rate of in-procedure SBP/MAP excursions to >120% was independently associated with lower ILV, while higher in-procedure mean SBP/MAP was associated with lower odds of hemorrhages. mRS 0-2 was achieved in 75/155 (48.4%) evaluated patients (nine had missing mRS data). Higher rate of SBP/MAP excursions to >120% and higher reference SBP/MAP were independently associated with higher odds of mRS 0-2, while higher ILV was associated with lower odds of mRS 0-2. Rate of SBP/MAP excursions to <80% was not associated with any outcome.

Conclusions

In the EVT-treated patients with BP managed within the recommended limits, a better functional outcome might be achieved by targeting in-procedure BP that exceeds the preprocedure values by more than 20%.

Introduction

Critical blood pressure (BP) values in the acute ischemic stroke patients undergoing reperfusion treatment are based on the exclusion criteria in the pivotal Phase III trials of recombinant human tissue plasminogen activator (rtPA) [1,2]. These BP limits were applied in the most recent endovascular thrombectomy (EVT) studies [3]. However, there have been no randomized controlled trials specifically evaluating the proposed BP limits and there is uncertainty whether BP level of 185/105 mm Hg as an exclusionary criterion for reperfusion treatments can be generalized [4]. Notably, studies in hypertensive patients demonstrated a shift of the limits of functional cerebral blood flow autoregulation to higher values in patients with higher pre-stroke BP levels [5,6]. Thus, keeping BP at a certain universally defined level during the most vulnerable phase of acute cerebral ischemia seems counterintuitive. In animals models of stroke, cerebral blood flow in moderately under-perfused tissue depends on systemic BP and any significant drop in BP is likely to compromise penumbra viability [7]. However, BP beyond the proposed limits could be detrimental due to higher risk of post-reperfusion hemorrhages after EVT [8]. Oscillations in systolic blood pressure (SBP) after EVT may also be associated with poorer outcomes [9]. Earlier studies suggested U-shaped associations between on-admission BP and favorable clinical outcomes in ischemic stroke patients, but also poorer outcomes in patients with generally higher BP throughout hospitalizations [10-12]. One recent analysis reported an association between higher maximum in-procedure SBP and poor 30-day outcomes, while several others suggested the opposite—associations between poorer outcomes and indicators of BP dips [13-16]. Thus, we hypothesized that during EVT it would be reasonable to target individualized BP values. We therefore investigated the relationship between in-procedure SBP and mean arterial pressure (MAP) excursions to above or below the limits defined in respect to their pre-procedure values and (1) post-procedure imaging findings: ischemic lesion volume (ILV) and visible hemorrhages; (2) 3-month functional outcomes; in a cohort of adults with anterior circulation ischemic stroke treated with EVT.

Methods

Design

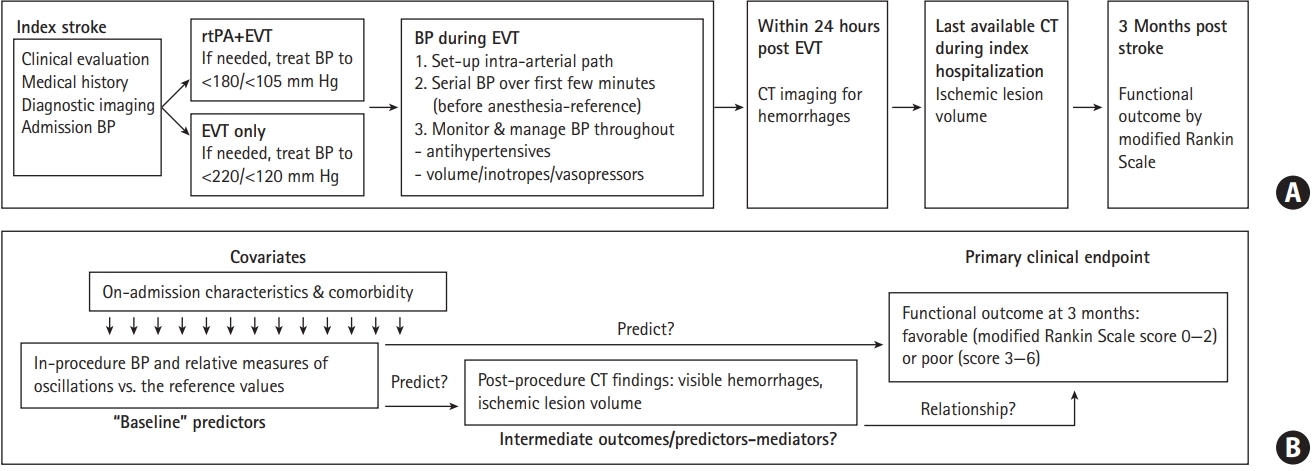
This is a retrospective analysis of a single-center prospective database comprising adults (age ≥18 years) with a symptomatic acute ischemic stroke due to occlusion of the internal carotid artery and/or middle cerebral artery treated with EVT using modern stent retrievers (a few patients received thrombus aspiration only) over a 5-year period (January 1, 2012 to December 31, 2016). It was approved by the Ethics Committee of Bundesland Salzburg. Figure 1A depicts the flow: patients underwent EVT under general anesthesia (GA) with or without intravenous rtPA, which individually required measures for BP reduction [4]; the analysis was restricted to patients with invasive BP measurement; serial BP values taken immediately before the start of EVT/induction of anesthesia were considered a “reference BP” for the period of the procedure; patients underwent post-procedure computed tomography (CT) imaging to assess hemorrhages and ILV, and were evaluated for the functional outcome at 3 months post-stroke (modified Rankin Scale [mRS]). We explored the associations between in-procedure BP oscillations defined in relative terms versus the “reference value” and (1) post-procedure ILV and visible hemorrhages; (2) favorable 3-month functional outcome (mRS 0-2) (Figure 1B).

Clinical evaluations

Stroke severity was assessed using the National Institutes of Health Stroke Scale (NIHSS). Indication for EVT was made in line with continuously updated standards, while indication for rtPA was in accordance with the Safe Implementation of Thrombolysis in Stroke-Monitoring Study [2,17]. At discharge, stroke etiology was classified according to the Trial of Org 10172 in Acute Stroke Treatment (TOAST) criteria [18]. Functional outcome at 3 months was assessed at scheduled visits or by a telephone interview with the patient or a proxy.

Radiological evaluations

CT or magnetic resonance was used to identify the vessel(s) portions occluded and to evaluate leptomeningeal collaterals on CT-angiography. Collaterals were graded as good when ≥50% were present as compared to the unaffected side. Postprocedure CT was used to evaluate presence of hemorrhages and last available CT during the index hospitalization to determine ILV [19]. The reperfusion success was graded by the Thrombolysis in Cerebral Infarction (TICI) scale: grades 2b (perfusion >50% of the vascular distribution of the occluded artery) and 3 (full perfusion with filling of all distal branches) were considered a success, grades 0-2a were considered a failure [20].

BP measurements and management

During EVT, BP was measured invasively every minute (except in two patients: every 2 or 5 minutes) and recordings were saved by the MetaVisionⓇ software (iMDsoft, Düsseldorf, Germany). Otherwise, it was measured regularly (cuff technique) and recorded in the patient charts. The in-house algorithm for acute stroke patients has been constantly in agreement with the respective guidelines, particularly in respect to the use of rtPA and EVT.

BP indicators

We determined the following BP indicators: (1) “reference” SBP/MAP as the mean of 3 to 5 measurements taken immediately before the start of EVT (induction of anesthesia); (2) individual values ±20% of the reference were determined and number of in-procedure excursions to values >120% or to <80% of the reference was counted to calculate their rates (episodes/10 minutes); (3) weighted mean in-procedure SBP/MAP by dividing area under the curve of BP over time (first to last in-procedure measurement) by the time period covered. We also determined rates of any excursions exceeding ±20% of the reference, and absolute (by linear interpolation) and relative (percent) time of the procedure with SBP/MAP >120% or <80% of the reference values.

Data analysis

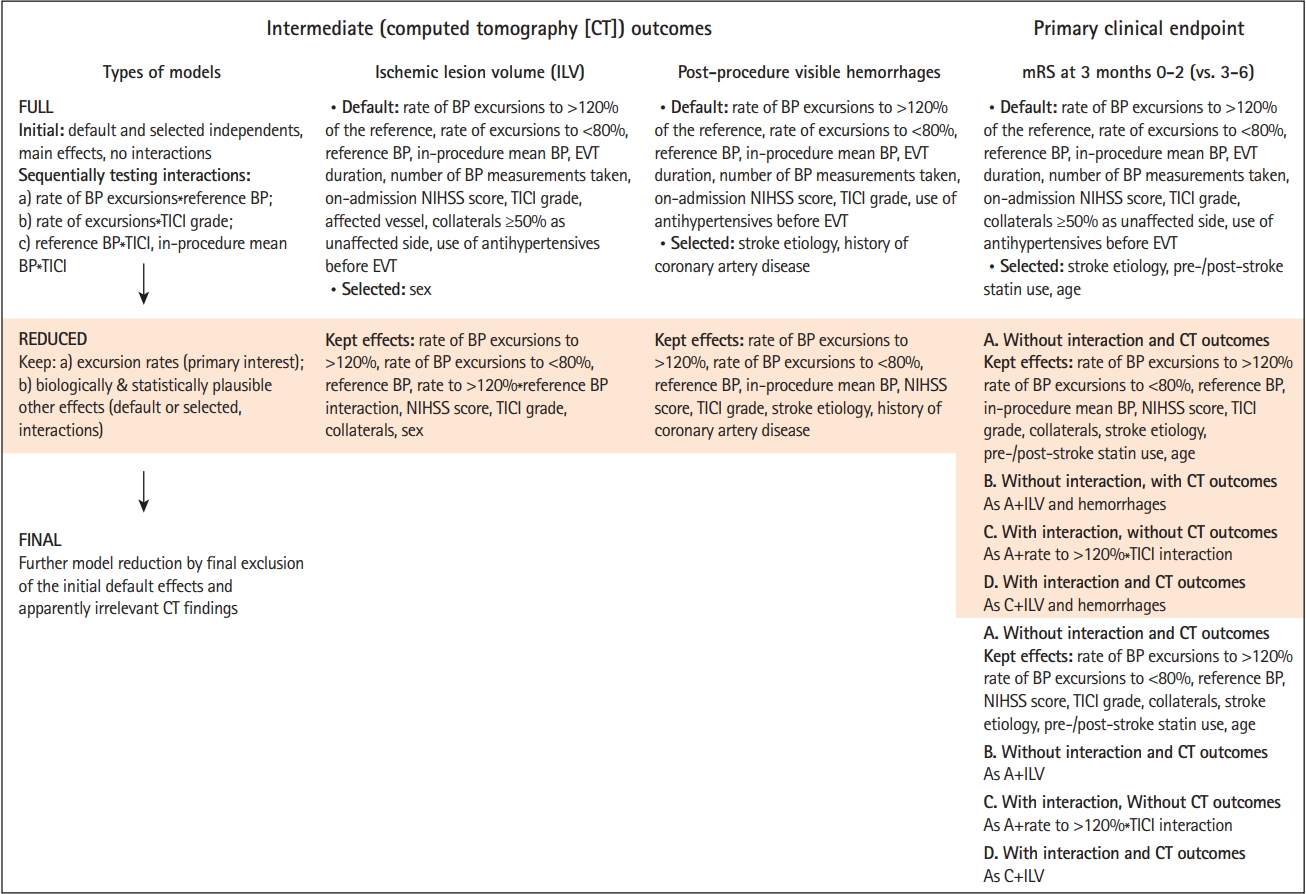
We first evaluated associations of in-procedure BP with postprocedure ILV and hemorrhages, and then with 3-month mRS 0-2 (Figure 1B). General linear models were fitted to ln-transformed ILV (effects are geometric mean ratio [GMR], exponents of coefficient obtained with logarithms) and logistic models were fitted to hemorrhages and mRS 0-2. We considered rates of excursions to >120% and to <80% of the reference (analyzed jointly due to potential off-setting effects) to be the primary indicators of BP oscillations, as they were determined directly. Analyses based on derived indicators (absolute/relative time) provided virtually identical results, and are not shown. Analyses of the rate of any excursions exceeding ±20% provided no additional information (also not shown).
Several models were fitted to each outcome starting with larger (“full”) models (default and selected effects [stepwise selection with P<0.200 to enter/stay] with sequential tests of interactions: excursion rates*reference BP, excursion rates*TICI grade, reference BP/in-procedure mean BP*TICI grade), from which “reduced” models (to avoid overfitting) were derived (effects of primary interest and biologically/statistically plausible adjustments). In the analysis of 3-month mRS, intermediate outcomes (ILV, hemorrhages) were introduced as adjustments into the “reduced” models, so model selection included a further step to “final” models. Figure 2 outlines the model selection procedure. For details on multivariate model building and selection see Supplementary Methods. Mediation analysis [21] evaluated possibility that the effects of BP on the functional outcome were mediated “through” the effects on ILV/hemorrhages. We used SAS version 9.4 statistical software (SAS Inc., Cary, NC, USA).

Results

Patients

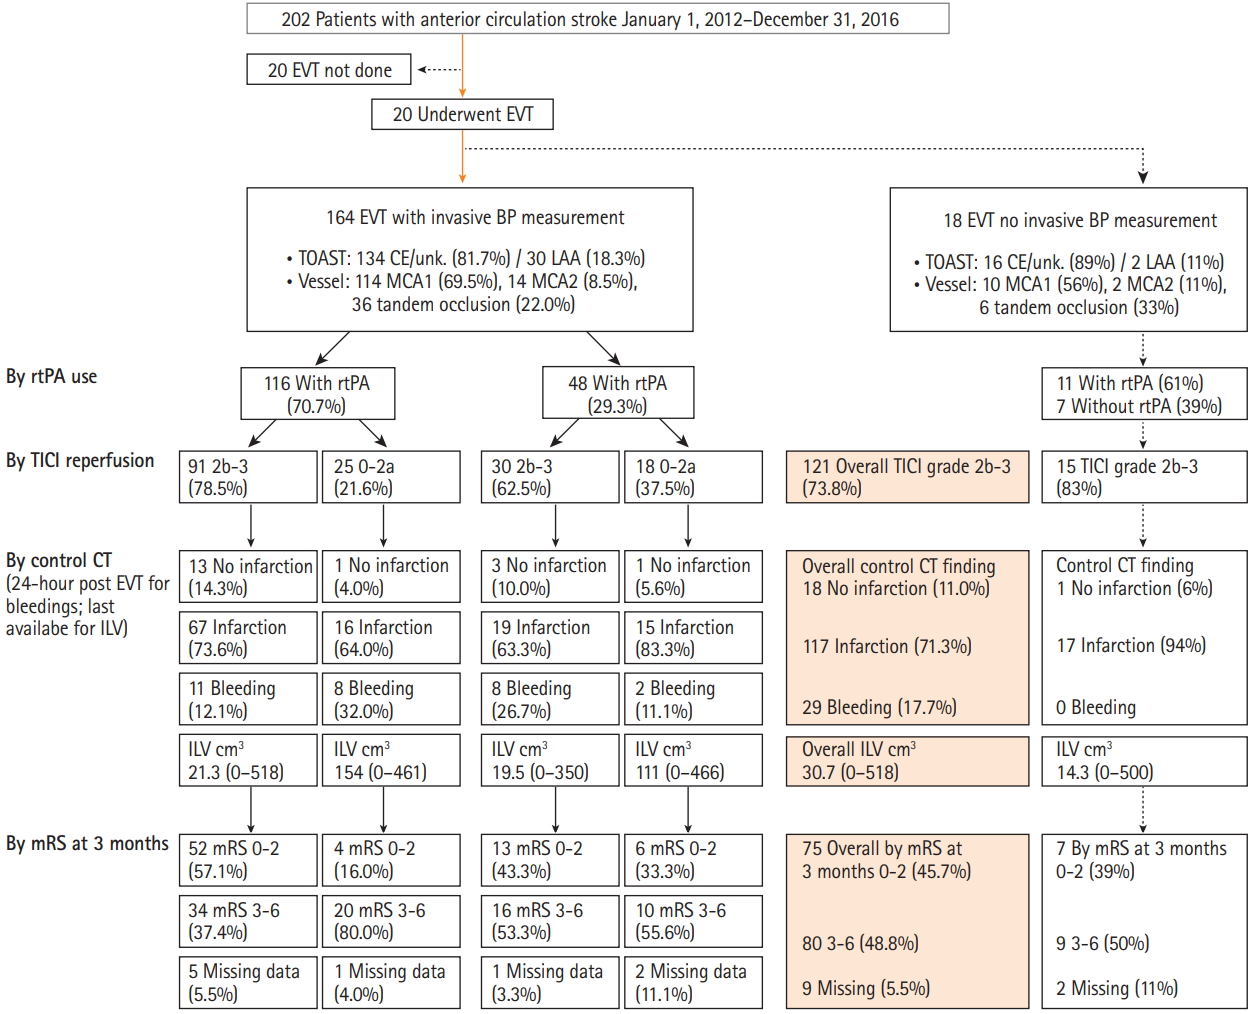
Of the 202 admitted patients, 20 did not undergo EVT and 18 did not have invasive BP monitoring. The cohort analyzed for ILV and hemorrhages comprised 164 patients, while 155 were analyzed for 3-month mRS (nine patients lacked data) (Figure 3).
Patient characteristics are summarized in Table 1 (Supplementary Table 1 for laboratory tests). Both on-admission and reference SBP/MAP varied greatly. Reference values appeared considerably lower than on-admission values, although intraindividual differences extended from substantial reduction to a substantial increase (Table 1). A total of 16 patients received antihypertensives between admission and EVT and two received sympathomimetics. Procedure lasted 12 to 587 minutes with 13 to 230 BP measurements, and 77 (46.9%) patients received sympathomimetics during EVT (Table 1). Overall, 38/164 (23.2%) patients had no excursions exceeding ±20% of the reference SBP/MAP, 68 and 70 (41.5% and 43.6% for SBP and MAP, respectively) experienced exclusively excursions to >120%, 37 and 31 (22.6% and 18.9%) exclusively excursions to <80%, and 21 and 25 (12.8% and 15.2%) experienced both. Data are summarized in Table 1 (see also Supplementary Table 2 and Supplementary Figure 1; for absolute/relative time >120% and <80% of the reference). Additional BP analysis (Supplementary Analysis of Blood Pressure) indicated that BPrelated procedures were guided by the intention to keep BP within the recommended limits, and not by the presenting stroke characteristics.

Relationship between in-procedure BP and ILV/post-procedure hemorrhages

Of the 164 patients, 132 (80.5%) had good collaterals, 121 (73.8%) achieved successful reperfusion, ILV ranged 0 to 518 cm3 and 29 (17.7%) patients had visible hemorrhages (Table 1). Full models were fitted to each outcome (see Supplementary Tables 3 and 4 for complete models). Independent variables consistently not associated with the outcomes were consecutively removed (Figure 2). Reduced models are shown in Table 2. Higher rate of in-procedure SBP excursions to >120% of the reference was associated with lower ILV, more so at higher reference values (rate*reference interaction) (Table 2). As an illustration, with reference SBP <120 mm Hg (n=62) the adjusted GMR=0.89 (interquartile range [IQR], 0.74 to 1.08), with reference SBP >135 mm Hg (n=60), GMR=0.34 (IQR, 0.15 to 0.74). The effect of SBP excursions was consistent in patients with TICI 0-2a (n=43) and TICI 2b-3 (n=121) (Supplementary Table 3). SBP excursions to <80% of the reference were not associated with ILV. Higher admission NIHSS score and male sex were associated with higher ILV; TICI grade 2b-3 and good collaterals were associated with lower ILV. Similar associations were observed for MAP, except for the excursions*reference interaction (Table 2).
In-procedure BP oscillations assessed by BP excursions were not associated with the post-procedure hemorrhages, higher reference SBP/MAP tended towards higher odds, while higher in-procedure mean SBP/MAP was associated with lower odds of hemorrhages (Table 2 and Supplementary Table 4). Higher in-procedure SBP/MAP was determined mainly by the higher reference SBP/MAP (Supplementary Analysis of Blood Pressure, Table F). Further analysis demonstrated that higher reference SBP/MAP was indirectly (via in-procedure mean) associated with lower odds of post-procedure hemorrhages: the indirect effect was practically identical in size to the direct effect (Table 2); hence, the total effect was close to zero (Supplementary Analysis of Post-Procedure Hemorrhages).

Relationship between in-procedure BP and 3-month functional outcome

Patients with mRS 0-2 (75/155, 48.4%) appeared younger, were more commonly men, and less commonly suffered comorbidities than the patients with mRS 3-6 (Table 1). They were more frequently pre-index stroke statin users, and less frequently antiplatelets or anticoagulants users (Table 1). On-admission NIHSS score, prevalence of cardioemobolic/unknown etiology and of tandem occlusions were lower while the use of rtPA was more common and the onset-to-EVT time was shorter in patients with mRS 0-2 (Table 1). Average on-admission and reference SBP/MAP appeared similar between the two subsets and similarly low numbers of patients received antihypertensives between admission and EVT. BP decline between admission and EVT appeared somewhat greater in patients with mRS 3-6 (Table 1). Weighted mean in-procedure SPB/MAP appeared comparable, while rates of excursions to >120% or to <80% of the reference appeared higher in patients with mRS 0-2. Similar proportions of patients received sympathomimetics during EVT (Table 1). Patients with mRS 0-2 more frequently had good collaterals, were more frequently successfully reperfused, their ILV was lower and visible hemorrhages were less frequent. They were less frequently post-stroke statin users, likely due to confounding by indication (Table 1).
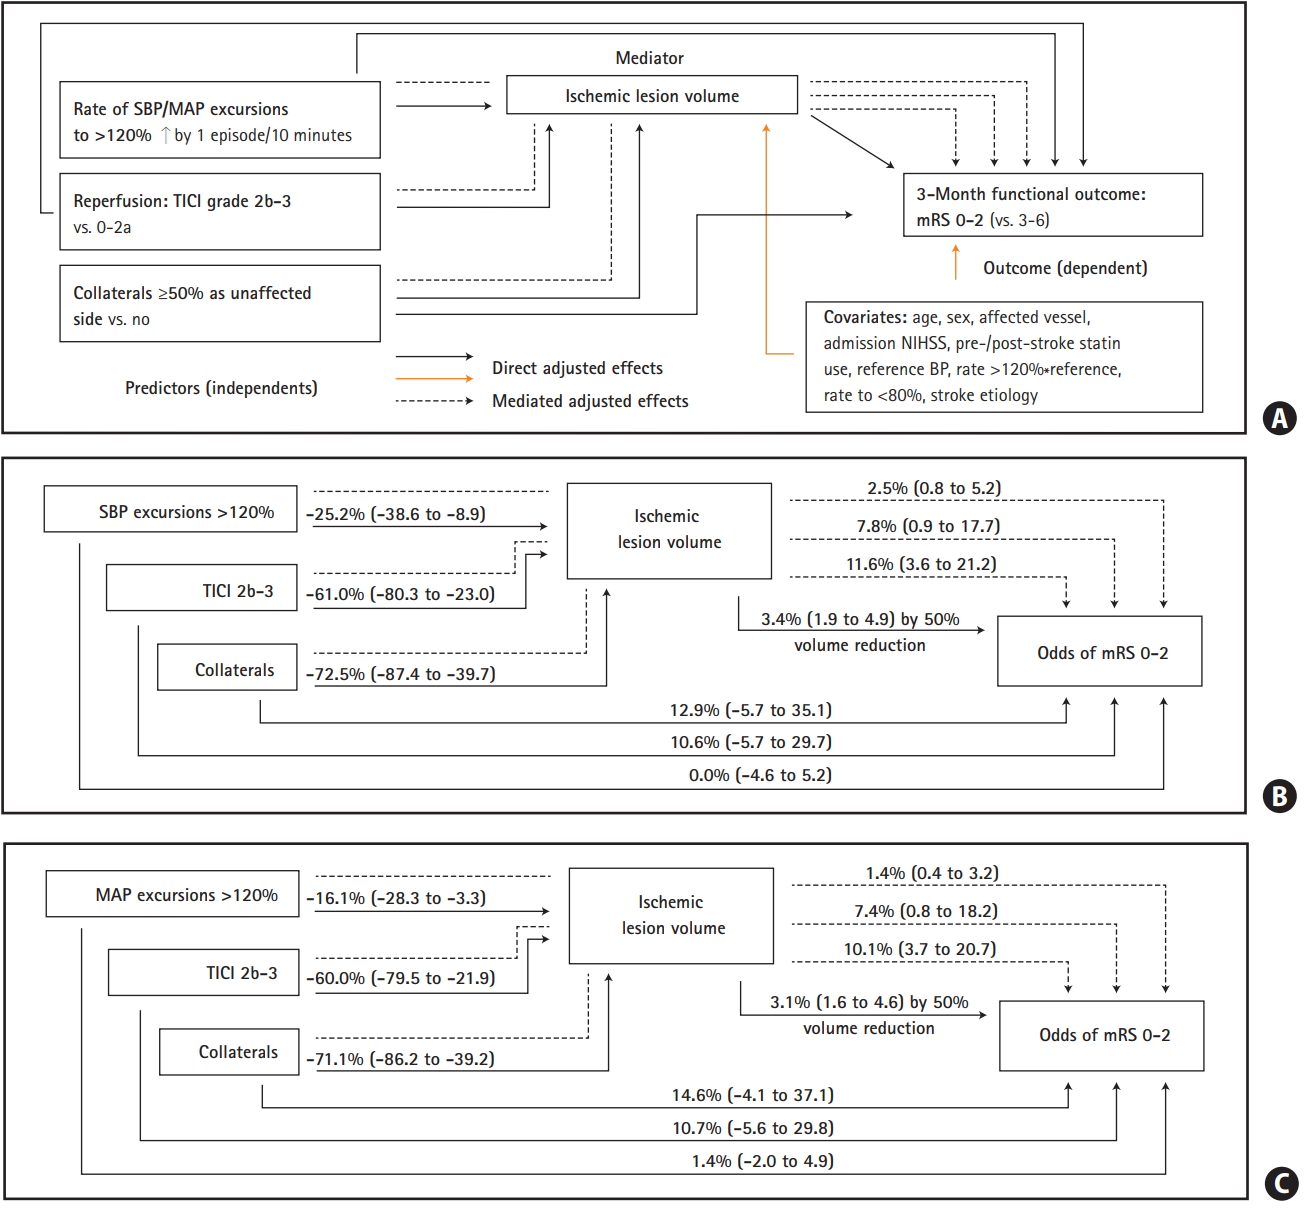
Full, reduced and final models were fitted to the outcome (see Supplementary Table 5 for complete models). Independent variables consistently not associated with mRS were consecutively removed (Figure 2). Final models are shown in Table 3. The rate of SBP/MAP excursions to <80% of the reference was not associated with the outcome (Table 3). When not accounting for ILV, higher rate of SBP/MAP excursions to >120%, TICI grade 2b-3, good collaterals and pre-index stroke statin use were associated with mRS 0-2 (Table 3, Model A). Higher onadmission NIHSS score, cardioembolic/unknown stroke etiology, post-index stroke statin use and older age were associated with lower odds of mRS 0-2 (Table 3, Model A). When accounted for, higher ILV was associated with lower odds of mRS 0-2 (Table 3, Model B). At the same time, the effects of SBP/MAP excursions, TICI grade and of collaterals were reduced to include unity (Table 3, Model B). Mediation analysis (Figure 4) showed an indirect (via ILV) association between higher rates of SBP/MAP excursions to >120% and mRS 0-2 (the same was shown for TICI 2b-3 and good collaterals).
Several models (Supplementary Table 5) indicated an interaction between the rate of SBP/MAP excursions to >120% and TICI grade: (1) a strong association between higher rates and mRS 0-2 in patients with TICI 2b-3 (n=115) and none in patients with TICI 0-2a (n=40) with point-estimates <1.0; (2) no association between TICI 2b-3 and mRS 0-2 in patients with zero excursion rates, with clear-cut associations between TICI 2b-3 and higher odds of mRS 0-2 at rates around 1.0/10 minutes and higher (Supplementary Table 5, Models final C, D). We consider final models without the interaction (Table 3) to more generally describe the data than the models with this (uncertain) interaction that did not indicate harms ascribable to SPB/MAP excursions (for the full rationale, see Supplementary Methods).

Discussion

We found that in anterior circulation stroke patients treated with EVT/rtPA, in whom BP was generally kept within the recommended limits, higher in-procedure SBP/MAP was associated with a better 3-month functional outcome. The findings are supported by the association of higher rates of in-procedure SBP/MAP excursions to >120% of the reference values, and of higher reference BP with mRS 0-2. The fact that no such association was observed for (higher) in-procedure mean BP is likely due to aliasing by the effects of a higher number of excursions over a high(er) reference value. A stronger association between BP excursions and in-procedure mean BP at higher reference BP supports such a view. Data also suggest associations between a higher rate of SBP/MAP excursions to >120% and lower ILV. Higher ILV was associated with lower odds of mRS 0-2, and mediation analysis that differentiates effects identifying indirect paths [21] plausible in a temporal and pathophysiological sense disclosed its mediator role: BP excursions are directly associated with lower ILV, lower ILV is directly associated with a better functional outcome, excursions affect functional outcome “through” the effects on ILV.
The analysis has limitations common to similar recent reports on the topic [13-16]—it did not account for the post-procedural BP; it did not test specific BP targets but evaluated spontaneously occurring patterns, where some, otherwise possible patterns, might not have occurred. Also, data on the initial infarct volume were not available. This leaves space for the assumption that patients with a larger initial infarct volume might have been managed at lower BP levels (to avoid hemorrhagic transformation), while a less stringent BP management might have been in place in patients with lower volumes, thus spuriously “grouping” poorer outcomes and lower BP (large initial volume), and better outcomes and higher BP (smaller initial volume). However, all observed associations were adjusted for on-admission NIHSS and use of antihypertensives between admission and EVT. It is reasonable to consider that these two variables to a large extent subsumed the “impact” of the initial infarct volume: if higher on-admission NIHSS (a “proxy” for larger infarct volume) would “go” together with higher on-admission BP, it would be associated also with immediate use of antihypertensives. However, our data showed that (1) higher on-admission BP but not NIHSS was associated with antihy-pertensive use; (2) BP reduction from admission to EVT (adjusted for on-admission BP) was similar in patients treated and not treated with antihypertensives; (3) neither on-admission NIHSS nor the use of antihypertensives were associated with reference BP or with in-procedure mean BP. Taken together, the findings suggest that the observed BP patterns were likely a consequence of the intended management within the recommended limits, and were not driven by the initial stroke severity (i.e., initial infarct volume). Furthermore, we consider invasive frequent BP recordings, inclusion of unselected patients, uniform anesthesia, and accounting for a number of confounders to be the study strengths.
Present findings apparently disagree with a similar recent report [13]. Individual in-procedure BP indicators (maximum, minimum, dips) were evaluated for association with 30-day mRS in 147 EVT-treated patients. In multivariate models (13 independents), higher maximum SBP was associated with lower odds of mRS 0-2. The only other significant effect was admission NIHSS, while collaterals, stroke etiology, ILV were not considered [13]. The cohort differed from ours in respect to anesthesia (46% GA), less common rtPA use (35.8%), fewer reperfusion successes (50%), lower mRS 0-2 achievement (17%), and fewer BP recordings (every 5 minutes) [13]. The apparently discordant results might be due to these methodological and cohort differences.
Three further similar studies indirectly support the present findings but also oppose them in a way [14-16]. All three studies suggest benefits of “higher” in-procedure BP, but imply this indirectly by recognizing detrimental consequences of low(er) MAP, i.e., in-procedure MAP dips, which we could not confirm. In one study (EVT under GA), at least one episode of MAP decline >40% from the baseline value was associated with 3-month mRS 3-6, but time spent at this MAP level was not [14]. Another (smaller) analysis (EVT under GA) reported no association between the largest in-procedure MAP decline from the baseline value and 3-month mRS. However, lower (vs. baseline) average in-procedure MAP was associated with poorer mRS, while higher average MAP was associated with better mRS [15], thus being in line with present results. Detrimental effect of low(er) in-procedure MAP was suggested also in EVT under conscious sedation—lowest in-procedure MAP <100 mm Hg was associated with 3-month mRS 3-6 [16].
Despite methodological differences between the present and previous reports, there is evidence of detrimental consequences of low in-procedure MAP [14-16]. This is in apparent disagreement with the reported association between high(er) SBP during the first 24 hours post-EVT and poor functional outcomes [9,22]. It seems that management of BP in anterior circulation acute stroke patients undergoing EVT requires different strategies: one focused on in-procedure targets and prevention of excessive dips, the other focused on the post-procedural period targeting lower levels with a prompt management of excessive peaks.

Conclusions

In the EVT-treated acute anterior circulation stroke patients in whom BP is managed within the currently recommended limits, a better functional outcome might be achieved by targeting in-procedure BP that exceeds the pre-procedure values by more than 20%.

Supplementary materials

Supplementary materials related to this article can be found online at https://doi.org/10.5853/jos.2018.01305.
Supplementary Table 1.
Routine laboratory test results taken on admission or within 24 hours, overall and by mRS score at 3 months
jos-2018-01305-suppl1.pdf
Supplementary Table 2.
Absolute (minutes) and relative (%) time spent with SBP and MAP >120% or <80% of the reference value, overall and by mRS score at 3 months
jos-2018-01305-suppl2.pdf
Supplementary Table 3.
Relationship between BP/BP excursions during EVT to values exceeding ±20% of the reference value and ischemic lesion volume (computed tomography scans)
jos-2018-01305-suppl3.pdf
Supplementary Table 4.
Relationship between BP/BP excursions during EVT to values exceeding ±20% of the reference value and finding of hemorrhages on post-procedure computed tomography scans
jos-2018-01305-suppl4.pdf
Supplementary Table 5.
Relationship between BP/BP excursions during EVT to values exceeding ±20% of the reference value and favorable functional outcome at 3 months (mRS, score 0-2)
jos-2018-01305-suppl5.pdf
Supplementary Figure 1.
Rates of blood pressure excursions during endovascular procedure to >120% or to <80% of the reference. Patients are classified by the rate of episodes (n/10 minutes) to <80% as those with none, up to 1 and >1 episode/10 minutes, while actual rates are given on the y-axis: rates to >120% of the reference (upper panel) and to <80% of the reference (lower panel). Dots are individual data, shaded bars illustrate frequency of rates and numbers are counts of patients with no excursions to >120% of the reference.
jos-2018-01305-suppl6.pdf
Supplementary Methods
Data analysis: multivariate model building procedures
jos-2018-01305-suppl7.pdf
Supplementary Analysis of Blood Pressure
Relationship between on-admission blood pressure (BP), BP at the start of endovascular thrombectomy (EVT), use of BP-related treatments between admission and EVT, use of sympathomimetics during EVT, weighted mean BP during EVT and rate of BP oscillations
jos-2018-01305-suppl8.pdf

Notes

Disclosure
The authors have no financial conflicts of interest.

Figure 1.
(A) Patient flow. (B) Steps in data analysis. We analyzed relationships between blood pressure (BP) during endovascular thrombectomy (EVT) with or without recombinant tissue plasminogen activator (rtPA) with (1) post-procedure computed tomography (CT) findings: ischemic lesion volume (ILV) and visible hemorrhages; (2) functional outcome at 3 months. We explored a possibility of a mediated association: in-procedure BP → ILV/visible hemorrhage → 3-month functional outcome.
jos-2018-01305f1.jpg
Figure 2.
Model selection strategy. All models were fitted separately for systolic blood pressure (BP) and mean arterial pressure. TICI, Thrombolysis in Cerebral Infarction; EVT, endovascular thrombectomy; NIHSS, National Institutes of Health Stroke Scale; mRS, modified Rankin Scale.
jos-2018-01305f2.jpg
Figure 3.
Disposition of patients. EVT, endovascular thrombectomy; BP, blood pressure; TOAST, Trial of Org 10172 in Acute Stroke Treatment classification; CE, cardioembolic; unk., unknown etiology; LAA, large artery atherosclerosis; MCA, middle cerebral artery, segment 1, segment 2; rtPA, recombinant human tissue plasminogen activator; TICI, Thrombolysis in Cerebral Infarction; CT, computed tomography; ILV, ischemic lesion volume; mRS, modified Rankin Scale.
jos-2018-01305f3.jpg
Figure 4.
Mediation analysis: association of in-procedure systolic blood pressure (SBP) and mean arterial pressure (MAP) excursions to >120% of their reference values with 3-month modified Rankin Scale (mRS) score 0-2 is mediated through their association with the ischemic lesion volume (ILV). (A) Outline of associations. All associations are adjusted for all other model effects. Effects are from models analyzing ILV (Table 2) and mRS (Table 3). (B) Mediation model for SBP. (C) Mediation model for MAP. Higher rate of blood pressure (BP) excursions, Thrombolysis in Cerebral Infarction (TICI) scale grade 2b-3 and good collaterals are each directly associated with lower ILV; lower ILV is directly associated with higher odds of mRS 0-2; direct association of these predictors with mRS 0-2 is uncertain; each is associated with mRS 0-2 indirectly, via ILV. Effects are expressed as percent change in ILV or odds of mRS 0-2 with 95% confidence interval. NIHSS, National Institute of Stroke Scale.
jos-2018-01305f4.jpg
Table 1.
Patient and procedure characteristics, overall and by 3-month functional outcome*
Characteristic All patients mRS 0-2 mRS 3-6 Missing mRS
Number 164 75 80 9
Age (yr) 74 (20-92) 67 (20-91) 79 (44-92) 74 (52-89)
Male sex 73 (44.5) 37 (49.3) 31 (38.8) 5 (55.6)
Atrial fibrillation 64 (39.0) 23 (30.7) 36 (45.0) 5 (55.6)
Previous stroke 18 (11.0) 8 (11.0) 8 (10.0) 2 (22.2)
Peripheral artery disease 11 (6.7) 4 (5.3) 7 (8.8) 0 (0)
Ischemic heart disease 35 (21.3) 9 (12.0) 25 (31.3) 1 (11.1)
Carotid stenosis ≥50% 17 (10.4) 8 (10.7) 8 (10.0) 1 (11.1)
Hypertension 106 (64.6) 41 (54.7) 59 (73.8) 6 (66.7)
Diabetes mellitus 21 (12.8) 7 (9.3) 13 (16.3) 1 (11.1)
Chronic heart failure 26 (16.2) 8 (11.0) 18 (22.8) 0 (0)
Chronic renal failure 16 (9.9) 4 (56.42) 12 (15.2) 0 (0)
Pre-admission statins 135 (82.8) 68 (90.7) 60 (75.0) 1 (87.5)
Pre-admission antiplatelets 45 (27.4) 15 (20.0) 28 (35.0) 2 (22.2)
Pre-admission anticoagulants 29 (17.7) 9 (12.0) 18 (22.5) 2 (22.2)
On-admission systolic BP (mm Hg) 150 (83-223) 150 (100-210) 154 (83-223) 148 (110-192)
On-admission MAP (mm Hg) 107 (56-174) 106 (67-143) 108 (56-174) 106 (70-135)
NIHSS at presentation 18 (3-32) 16 (3-31) 20 (3-32) 18 (7-24)
Onset to first vessel imaging (min) 189 (98-900) 181 (98-374) 208 (99-639) 165 (111-900)
TOAST: cardioembolic or unknown 134 (81.7) 54 (72.0) 72 (90.0) 8 (88.9)
rtPA used 116 (70.7) 56 (74.7) 54 (67.5) 6 (66.7)
Middle cerebral artery segment 1 114 (69.5) 52 (69.3) 55 (68.8) 7 (77.8)
Middle cerebral artery segment 2 14 (8.5) 8 (10.7) 4 (5.0) 2 (22.2)
Tandem occlusion 36 (22.0) 15 (20.0) 21 (26.3) 0 (0)
Procedure duration (min) 83 (12-587) 65 (12-202) 109 (17-587) 72 (17-188)
BP measurements/procedure (n) 83 (13-230) 66 (13-203) 108 (18-230) 73 (18-189)
BP measurements/minute 1.0 (0.2-2.4) 1.0 (0.5-2.4) 1.0 (0.2-1.6) 1.0 (1.0-1.0)
SBP reference (mm Hg) 125 (73-203) 125 (93-203) 124 (73-191) 132 (98-182)
SBP ∆ reference-admission (mm Hg) -23 (-126 to 66) -19 (-88 to 43) -28 (-126 to 66) -23 (-53 to 37)
MAP reference (mm Hg) 88 (56-136) 91 (61-136) 87 (56-134) 84 (64-123)
MAP ∆ reference-admission (mm Hg) -17 (-101 to 50) -15 (-56 to 46) -18 (-101 to 50) -22 (-55 to 21)
BP treatment admission-to-procedure
 None 146 (89.0) 68 (90.7) 69 (86.3) 9 (100)
 BP-lowering (urapidil, clonidine) 16 (9.8) 7 (9.3) 9 (11.3) 0 (0)
 BP-increasing (sympathomimetics) 2 (1.2) 0 (0) 2 (2.5) 0 (0)
Procedure mean SBP (mm Hg) 128 (69-192) 126 (83-168) 126 (67-192) 142 (106-158)
Procedure mean MAP (mm Hg) 91 (43-125) 92 (56-117) 89 (43-125) 96 (66-112)
Rates of BP excursions vs. ref. (n/10 min)
 SBP >120% 1.09 (0-9.26) 1.21 (0-9.26) 0.93 (0-8.41) 1.63 (0-8.19)
 MAP >120% 1.19 (0-9.74) 1.31 (0-8.92) 1.03 (0-9.74) 1.95 (0-8.75)
 SBP <80% 0.97 (0-9.20) 1.26 (0-9.04) 0.82 (0-9.20) 0.66 (0-0.98)
 MAP <80% 0.79 (0-8.91) 1.08 (0-8.91) 0.66 (0-8.22) 0.11 (0-0.11)
Inotropes during procedure 77 (46.9) 33 (44.0) 38 (47.5) 6 (66.7)
Leptomeningeal collaterals
 Poor (<50% as on unaffected side) 32 (19.51) 6 (8.0) 24 (30.0) 2 (22.2)
 Good (≥50% as on unaffected side) 132 (80.5) 69 (92.0) 56 (70.0) 7 (77.8)
Reperfusion success (TICI class 2b-3) 121 (73.8) 65 (86.7) 50 (62.5) 6 (66.7)
Control CT
 No infarction, no hemorrhage 18 (11.0) 11 (14.7) 6 (7.5) 1 (11.1)
 Infarction only, no hemorrhage 117 (71.3) 53 (70.6) 56 (70.0) 8 (88.9)
 Hemorrhage visible 29 (17.7) 11 (14.7) 18 (22.5) 0 (0)
Ischemic lesion volume (cm3) 30.7 (0-518) 10.9 (0-466) 102 (0-518) 9.1 (0-127)
Post-procedure statin use 110 (67.5) 43 (57.3) 62 (77.5) 5 (62.5)
Values are presented as median (interquartile range) or number (%).
mRS, modified Rankin Scale; BP, blood pressure; MAP, mean arterial pressure; NIHSS, National Institutes of Health Stroke Scale; TOAST, Trial of Org 10172 in Acute Stroke Treatment classification; rtPA, recombinant human tissue plasminogen activator; SBP, systolic blood pressure; TICI, Thrombolysis in Cerebral Infarction; CT, computed tomography.
* mRS score: favorable (score 0 to 2) or poor (score 3 to 6);
Geometric mean ratio (interquartile range).
Table 2.
Relationship between BP/BP excursions during endovascular thrombectomy to values exceeding ±20% of the reference BP and control computed tomography findings
Variable Systolic blood pressure
Mean arterial pressure
GMR or OR (95% CI) P GMR or OR (95% CI) P
Ischemic lesion volume
 Default independent variables,
  Rate of BP >120% of reference (by 1/10 min) 0.72 (0.60-0.87) <0.001 0.75 (0.63-0.90) 0.002
  Rate of BP <80% of reference (by 1/10 min) 1.06 (0.91-1.25) 0.443 1.10 (0.93-1.31) 0.265
  Reference BP (by 10 mm Hg) 1.01 (0.85-1.19) 0.911 0.86 (0.69-1.07) 0.181
  Rate of BP excursions >120%*reference BP 0.86 (0.78-0.96) 0.006 0.95 (0.86-1.04) 0.264
  On-admission NIHSS score (by 1 point) 1.06 (1.01-1.11) 0.014 1.06 (1.01-1.10) 0.021
  TICI grade 2b-3 (vs. 0-2a) 0.36 (0.20-0.67) 0.001 0.36 (0.20-0.67) 0.042
  Affected vessel: MCA1 vs. other 0.65 (0.36-1.17) 0.153 0.72 (0.40-1.29) 0.270
  Collaterals ≥50% as unaffected side (vs. no) 0.33 (0.16-0.68) 0.002 0.33 (0.16-0.67) 0.003
 Selected independent variables
  Men (vs. women) 1.84 (1.07-3.17) 0.028 1.78 (1.03-3.07) 0.038
Post-procedure visible hemorrhages,§
 Default independent variables
  Rate of BP >120% of reference (by 1/10 min) 1.03 (0.72-1.48) 0.855 1.10 (0.82-1.50) 0.479
  Rate of BP <80% of reference (by 1/10 min) 0.80 (0.58-1.11) 0.183 0.77 (0.53-1.12) 0.178
  Reference BP (by 10 mm Hg) 1.48 (0.99-2.28) 0.056 1.86 (1.00-3.47) 0.051
  Procedure mean BP (by 10 mm Hg) 0.65 (0.40-0.96) 0.032 0.52 (0.26-0.95) 0.034
  TICI grade 2b-3 (vs. 0-2a) 0.62 (0.25-1.53) 0.298 0.61 (0.25-1.50) 0.280
 Selected independent variables
  Cardioembolic/unknown etiology (vs. LAA) 3.61 (0.81-28.8) 0.095 3.51 (0.64-19.4) 0.149
  History of coronary heart disease 2.58 (1.04-6.42) 0.041 2.56 (1.03-6.38) 0.043
BP, blood pressure; GMR, geometric mean ratio; OR, odds ratio; CI, confidence interval; NIHSS, National Institutes of Health Stroke Scale; TICI, Thrombolysis in Cerebral Infarction; MCA, middle cerebral artery (segment 1 or 2); LAA, large artery atherosclerosis.
* The asterisk is a part of the interaction term;
Reduced models;
GMR (95% CI);
§ OR (95% CI).
Table 3.
Relationship between BP/BP excursions during endovascular thrombectomy to values exceeding ±20% of the reference value and 3-month modified Rankin Scale score 0-2 (final models)
Variable Systolic blood pressure
Mean arterial pressure
OR (95% CI) P OR (95% CI) P
Model A: without imaging outcomes
 Default independents
  Rate of BP >120% of reference (by 1/10 min) 1.33 (1.01-1.76) 0.038 1.30 (1.01-1.66) 0.029
  Rate of BP <80% of reference (by 1/10 min) 0.85 (0.67-1.08) 0.174 0.85 (0.65-1.10) 0.218
  Reference BP (by 10 mm Hg) 1.37 (1.06-1.77) 0.013 1.49 (1.06-2.08) 0.016
  On-admission NIHSS score (by 1 point) 0.85 (0.78-0.93) <0.001 0.86 (0.80-0.94) <0.001
  TICI grade 2b-3 (vs. 0-2a) 3.96 (1.34-11.7) 0.009 3.72 (1.26-11.0) 0.013
  Collaterals ≥50% as unaffected side (vs. no) 4.62 (1.45-11.2) 0.007 4.71 (1.44-15.4) 0.006
 Selected independents
  Cardioembolic/unknown etiology (vs. LAA) 0.25 (0.07-090) 0.026 0.22 (0.06-0.84) 0.018
  Pre-index stroke statin use 5.88 (1.55-22.3) 0.005 4.71 (1.27-17.5) 0.013
  Post-index stroke statin use 0.32 (0.12-0.82) 0.015 0.34 (0.13-0.87) 0.020
  Age (by 10 yr) 0.69 (0.50-0.96) 0.020 0.72 (0.52-0.99) 0.039
Model B: including ischemic lesion volume
 Default independents
  Rate of BP >120% of reference (by 1/10 min) 1.25 (0.95-1.71) 0.114 1.22 (0.95-1.61) 0.115
  Rate of BP <80% of reference (by 1/10 min) 0.88 (0.69-1.11) 0.291 0.89 (0.67-1.15) 0.371
  Reference BP (by 10 mm Hg) 1.33 (1.02-1.77) 0.034 1.37 (0.97-1.97) 0.071
  On-admission NIHSS score (by 1 point) 0.87 (0.79-0.95) 0.002 0.88 (0.81-0.96) 0.003
  TICI grade 2b-3 (vs. 0-2a) 2.73 (0.89-9.10) 0.079 2.55 (0.83-8.46) 0.101
  Collaterals ≥50% as unaffected side (vs. no) 2.95 (0.88-11.2) 0.080 3.04 (0.91-11.5) 0.071
  Ischemic lesion volume (by 2.718-fold) 0.65 (0.50-0.83) <0.001 0.66 (0.50-0.84) <0.001
 Selected independents
  Cardioembolic/unknown etiology (vs. LAA) 0.19 (0.05-0.69) 0.011 0.16 (0.04-0.62) 0.007
  Pre-index stroke statin use 3.94 (1.08-16.8) 0.037 3.48 (0.97-14.8) 0.057
  Post-index stroke statin use 0.34 (0.12-0.88) 0.026 0.33 (0.12-0.87) 0.025
  Age (by 10 yr) 0.63 (0.43-0.87) 0.005 0.65 (0.45-0.90) 0.010
BP, blood pressure; OR, odds ratio; CI, confidence interval; NIHSS, National Institutes of Health Stroke Scale; TICI, Thrombolysis in Cerebral Infarction; LAA, large artery atherosclerosis.

References

1. National Institute of Neurological Disorders and Stroke rt-PA Stroke Study Group. Tissue plasminogen activator for acute ischemic stroke. N Engl J Med 1995;333:1581-1587.
crossref pmid
2. Hacke W, Kaste M, Bluhmki E, Brozman M, Dávalos A, Guidetti D, et al. Thrombolysis with alteplase 3 to 4.5 hours after acute ischemic stroke. N Engl J Med 2008;359:1317-1329.
crossref pmid
3. Berkhemer OA, Fransen PS, Beumer D, van den Berg LA, Lingsma HF, Yoo AJ, et al. A randomized trial of intraarterial treatment for acute ischemic stroke. N Engl J Med 2015;372:11-20.
crossref pmid
4. Powers WJ, Rabinstein AA, Ackerson T, Adeoye OM, Bambakidis NC, Becker K, et al. 2018 Guidelines for the early management of patients with acute ischemic stroke: a guideline for healthcare professionals from the American Heart Association/American Stroke Association. Stroke 2018;49:e46-e110.
crossref pmid
5. Strandgaard S. Autoregulation of cerebral blood flow in hypertensive patients. The modifying influence of prolonged antihypertensive treatment on the tolerance to acute, druginduced hypotension. Circulation 1976;53:720-727.
crossref pmid
6. Strandgaard S, Olesen J, Skinhoj E, Lassen NA. Autoregulation of brain circulation in severe arterial hypertension. Br Med J 1973;1:507-510.
crossref pmid pmc
7. Dirnagl U, Pulsinelli W. Autoregulation of cerebral blood flow in experimental focal brain ischemia. J Cereb Blood Flow Metab 1990;10:327-336.
crossref pmid
8. Mistry EA, Mistry AM, Nakawah MO, Khattar NK, Fortuny EM, Cruz AS, et al. Systolic blood pressure within 24 hours after thrombectomy for acute ischemic stroke correlates with outcome. J Am Heart Assoc 2017;6:e006167.
crossref pmid pmc
9. Bennett AE, Wilder MJ, McNally JS, Wold JJ, Stoddard GJ, Majersik JJ, et al. Increased blood pressure variability after endovascular thrombectomy for acute stroke is associated with worse clinical outcome. J Neurointerv Surg 2018;10:823-827.
crossref pmid
10. Castillo J, Leira R, García MM, Serena J, Blanco M, Dávalos A. Blood pressure decrease during the acute phase of ischemic stroke is associated with brain injury and poor stroke outcome. Stroke 2004;35:520-526.
crossref pmid
11. Grabska K, Niewada M, Sarzyńska-Długosz I, Kamiński B, Członkowska A. Pulse pressure: independent predictor of poor early outcome and mortality following ischemic stroke. Cerebrovasc Dis 2009;27:187-192.
crossref
12. Leonardi-Bee J, Bath PM, Phillips SJ, Sandercock PA; IST Collaborative Group. Blood pressure and clinical outcomes in the International Stroke Trial. Stroke 2002;33:1315-1320.
crossref pmid
13. John S, Hazaa W, Uchino K, Toth G, Bain M, Thebo U, et al. Lower intraprocedural systolic blood pressure predicts good outcome in patients undergoing endovascular therapy for acute ischemic stroke. Interv Neurol 2016;4:151-157.
crossref pmid pmc
14. Löwhagen Hendén P, Rentzos A, Karlsson JE, Rosengren L, Sundeman H, Reinsfelt B, et al. Hypotension during endovascular treatment of ischemic stroke is a risk factor for poor neurological outcome. Stroke 2015;46:2678-2680.
crossref pmid
15. Treurniet KM, Berkhemer OA, Immink RV, Lingsma HF, Wardvan der Stam VMC, Hollmann MW, et al. A decrease in blood pressure is associated with unfavorable outcome in patients undergoing thrombectomy under general anesthesia. J Neurointerv Surg 2018;10:107-111.
crossref pmid
16. Whalin MK, Halenda KM, Haussen DC, Rebello LC, Frankel MR, Gershon RY, et al. Even small decreases in blood pressure during conscious sedation affect clinical outcome after stroke thrombectomy: an analysis of hemodynamic thresholds. AJNR Am J Neuroradiol 2017;38:294-298.
crossref pmid pmc
17. Wahlgren N, Ahmed N, Dávalos A, Ford GA, Grond M, Hacke W, et al. Thrombolysis with alteplase for acute ischaemic stroke in the Safe Implementation of Thrombolysis in Stroke-Monitoring Study (SITS-MOST): an observational study. Lancet 2007;369:275-282.
crossref pmid
18. Adams HP Jr, Bendixen BH, Kappelle LJ, Biller J, Love BB, Gordon DL, et al. Classification of subtype of acute ischemic stroke. Definitions for use in a multicenter clinical trial. TOAST. Trial of Org 10172 in Acute Stroke Treatment. Stroke 1993;24:35-41.
crossref pmid
19. Pikija S, Trkulja V, Mutzenbach JS, McCoy MR, Ganger P, Sellner J. Fibrinogen consumption is related to intracranial clot burden in acute ischemic stroke: a retrospective hyperdense artery study. J Transl Med 2016;14:250.
crossref pmid pmc
20. John S, Hazaa W, Uchino K, Hussain MS. Timeline of blood pressure changes after intra-arterial therapy for acute ischemic stroke based on recanalization status. J Neurointerv Surg 2017;9:455-458.
crossref pmid
21. Preacher KJ, Hayes AF. SPSS and SAS procedures for estimating indirect effects in simple mediation models. Behav Res Methods Instrum Comput 2004;36:717-731.
crossref pmid
22. Goyal N, Tsivgoulis G, Pandhi A, Chang JJ, Dillard K, Ishfaq MF, et al. Blood pressure levels post mechanical thrombectomy and outcomes in large vessel occlusion strokes. Neurology 2017;89:540-547.
crossref pmid


ABOUT JoS
AUTHOR INFORMATION
ARTICLE CATEGORY

Browse all articles >

BROWSE ARTICLES
Editorial Office
Department of Neurology, Asan Medical Center,Ulsan University College of Medicine
88, Olympic-ro 43-gil, Songpa-gu, Seoul 05505, Korea
Submission, status and progress, etc ⟫ E-mail: editor@j-stroke.org
Website and system ⟫ E-mail: journal@m2community.co.kr
Publishing company ⟫ E-mail: ka72sus@smileml.com
Developed in M2PI
Copyright © 2024 by Korean Stroke Society.
Close layer
prev next