Geographic Variations of Stroke Incidence in Chinese Communities: An 18-Year Prospective Cohort Study from 1997 to 2015
Article information
Abstract
Background and Purpose
As a leading cause of disability and death in China, stroke as well as its epidemiologic features have gained increasing attention. Prior studies, however, have overgeneralized the north-to-south gradient in China. Whether the differences exist across urban and rural areas remains unexplored. This study therefore aims to investigate the north-to-south gradient in stroke incidence across urban and rural China.
Methods
The present prospective cohort study analyzed data from the China Health and Nutrition Survey 1997 to 2015. By including 16,917 individuals from diverse social contexts, we calculated the age-standardized incidence of stroke across regions and the age-adjusted risk ratio (aRR). Cox proportional hazards models with time-varying covariates were employed to analyze variations in incident stroke.
Results
During the follow-up, age-standardized incidence of stroke ranged from 4.17 per 1,000 person-years (95% confidence interval [CI], 3.38 to 4.96) in the north region to 1.95 (95% CI, 1.60 to 2.30) in the south region (aRR, 2.04; 95% CI, 1.58 to 2.64; P<0.001). The north-to-south gradient of stroke incidence was observed only in rural areas, but not in urban areas. Hierarchical modelling analyses further indicated that the regional differences could be mostly explained by the disparities in the prevalence of hypertension.
Conclusions
The present study extends the current evidence on the north-to-south gradient by demonstrating that the difference varied across urban and rural China. Our findings highlight the importance of hypertension management as the measure for alleviating regional differences in stroke incidence.
Introduction
Although geographic variations have been widely recognized as a challenging public health concern [1-3], the variations in stroke burden have not been fully clarified. As a leading cause of disability and death in China [4,5], stroke as well as its epidemiologic features have gained increasing attention. Previous studies have reported a north-to-south gradient in the prevalence of stroke in China [4,6,7]. The prevalence measure, however, could not fully reflect the epidemiologic transition in current China, as it is sensitive to changes in the life expectancy [7-9]. Along with the rapid socio-economic development over the past two decades, the average lifespan in China has increased from 70.43 years in 1997 to 75.93 in 2015, with 10.92% population aged over 65 [10,11]. Therefore, up-to-date information regarding geographic variations in stroke incidence is warranted.
Earlier studies, however, have limitations and knowledge gaps that should be addressed and bridged in a comprehensive way. First, prior investigations directed insufficient attention on the interaction between regional variations and urban vs. rural differences in the epidemiologic features of stroke, although empirical evidence on population health indicated that regional disparities in urban China tended to be marginal due to rapid urbanization [12]. Whether the north-to-south gradient in stroke incidence varies across urban and rural areas in China is unknown. Furthermore, prior research had a major limitation of retrospective cohort or cross-sectional study-designs [4,6,7,13], which were not able to provide robust estimates of the attributable risk factors of the disparities.
Overall, this study aims to (1) examine the north-to-south gradient in stroke incidence and their interaction with urban versus rural settings. Meanwhile, this project has an advantage of prospective cohort study-design to (2) analyze the potential attributable risk factors of the geographic variations in stroke incidence.
Methods
All data and materials have been made publicly available at the website of the China Health and Nutrition Survey (CHNS) and can be accessed at https://www.cpc.unc.edu/projects/china.
Data source
The present study analyzed data from the CHNS. CHNS included over 30,000 individuals from twelve provinces and three provincial-level cities in China. Launched in 1989, this ongoing open cohort has been jointly conducted by the Carolina Population Center at the University of North Carolina at Chapel Hill and the National Institute for Nutrition and Health at the Chinese Center for Disease Control and Prevention. CHNS employed a multistage random cluster process to draw the study sample and included individuals from diverse social contexts (e.g., low-, middle-, and high-income counties). As of May 2020, CHNS has released data of ten wave periods of 1989, 1991, 1993, 1997, 2000, 2004, 2006, 2009, 2011, and 2015. Details of the survey design, sampling procedures, data collection, and quality control have been published previously [14].
Study design and sample collection
This study employed a prospective cohort study-design. Because CHNS did not record self-reported disease outcomes until 1997, the present study included data from 1997 to 2015. Because of the low prevalence of stroke among neonates and children [15], we included individuals aged over 18 years old. Focusing on stroke incidence, we enrolled stroke-free individuals at his/her entry point and excluded individuals with only one observation. Last, observations after the diagnosis of stroke were excluded. Details regarding the sample collection are provided in Supplementary Figure 1.
Measures
We employed the self-reported diagnosis of stroke as the health outcome. As three provinces were not enrolled in CHNS until 2015, the present study included individuals from nine provinces and three provincial-level cities. According to the latitude, provinces and provincial-level cities were clustered as the south region, the central region, and the north region to explore the north-to-south differences (Figure 1A). Each region consisted of several provinces as well as one provincial-level city, which represented a highly urbanized metropolitan area. Urban-rural settings were derived from CHNS.

Study area and age-standardized incidence across provinces. The age-standardized incidence was calculated by using the study sample in the Guangxi province as the standard population. Details about age-standardized incidence are provided in Supplementary Table 1. (A) The study area included nine provinces and three provincial-level cities: Beijing, Chongqing, Guangxi, Guizhou, Heilongjiang, Henan, Hubei, Hunan, Jiangsu, Liaoning, Shandong, and Shanghai. (B) Overall age-standardized stroke incidence, per 1,000 person-years. (C) Age-standardized stroke incidence among men, per 1,000 person-years. (D) Age-standardized stroke incidence among women, per 1,000 person-years.
Furthermore, we included multiple potential risk factors of stroke, including socio-demographic status (age, sex, race, marital status, employment, and educational level), lifestyle behaviors (body mass index [BMI] and smoking history), and self-reported disease history (hypertension, diabetes mellitus, and myocardial infarction) [4,5,7,13,16].
Data analyses
To compare baseline characteristics across regions, we conducted multiple significance tests (Pearson chi-square tests, analysis of variance [ANOVA], and Kruskal-Wallis rank-sum tests) according to data characteristics. To depict the geographic variations in the incidence of stroke, we calculated the crude incidence as described below:
We then calculated the age-standardized incidence of stroke in each region, using the south region study sample as the standard population. To compare the age-standardized incidence across regions, log-binomial regression was performed to calculate age-adjusted risk ratios (aRRs).
To further investigate the geographic variations in stroke incidence, we employed the extended Cox proportional hazards models. Hierarchical modelling analyses were performed to investigate potential attributable risk factors of the geographic variations. In addition, we designated time-varying covariates to control for changes in potential risk factors over time. We clustered observations from the same individual to generate robust standard errors. The interaction between urban versus rural settings and geographic regions was included in the models to estimate regional differences across urban and rural areas. As for subgroup analyses, we repeated the modeling analyses by sex.
Missing values and sensitivity analyses
The percent of missing values ranged from 0.8% for marital status to 7% for BMI. Missing covariates were imputed with data from prior observations. As covariates, such as hypertension, smoking history, and employment status, may change over time, we conducted additional modelling analyses by using the dataset with missing values. In addition, as differences remained in various statistical techniques when estimating rate ratios [17], we estimated incidence rate ratios and odds ratios respectively from Poisson regression and logistic regression as well as Mantel-Haenszel rate ratios stratified by age groups. Furthermore, the main outcome was a self-reported stroke occurrence, which was likely to be influenced by educational level and age. To reduce the recall bias and underestimation, we repeated the modeling analyses restricted to individuals with at least middle school education and aged under 65 years old at baseline. The rationale was that better educated and younger individuals might have higher disease awareness and memory function.
Statistical analyses were performed with Stata/SE 15.0 (StataCorp., College Station, TX, USA). A two-tailed P-value of less than 0.05 was considered statistically significant.
Ethics approval
CHNS was approved by the ethics committee of Carolina Population Center at the University of North Carolina at Chapel Hill and the NINH at the CCDC. Informed consent was obtained from all subjects before the investigation. The present study derived data from the public domain, and therefore ethics statement and informed consents were not applicable.
Results
Study sample and baseline characteristics
Overall, this study included 66,380 observations from 16,917 individuals. The cohort accrued 169,004 person-years with an average follow-up of 9.99 years. During the follow-up, 442 stroke cases were identified with a crude incidence rate of 2.61 per 1,000 person-years (95% confidence interval [CI], 2.38 to 2.87). The mean age at entry into the cohort was 42.74±15.40 (range, 18 to 100) with no significant difference across the south, central, and north regions (P=0.06). However, there were differences in several baseline characteristics across regions. In general, individuals in the north region were more likely to be a smoker (P<0.001) and obese (P<0.001) and to have hypertension (P<0.001) and diabetes (P<0.01) as compared to those in the south and central regions (Table 1).
In addition, we examined the differences in baseline characteristics between the study sample and excluded individuals, i.e., those without stroke records or with only one observation. Excluded individuals were younger (40.41 years old vs. 42.74 years old, P<0.001) than the study sample. In comparison with those in the study, individuals not in the cohort were more likely to be obese (P<0.001), well-educated (P<0.001), and to live in urban rather than rural areas (P<0.001). Urban areas in the north region respectively had a 3.16% and 0.94% higher rate of missing stroke record as compared to their counterparts in the central and south regions (P<0.05). Likewise, in rural areas, the north region respectively had a 4.28% and 3.98% higher rate of missing stroke record in comparison with the central and south regions (P<0.001).
Age-standardized incidence and risk ratios
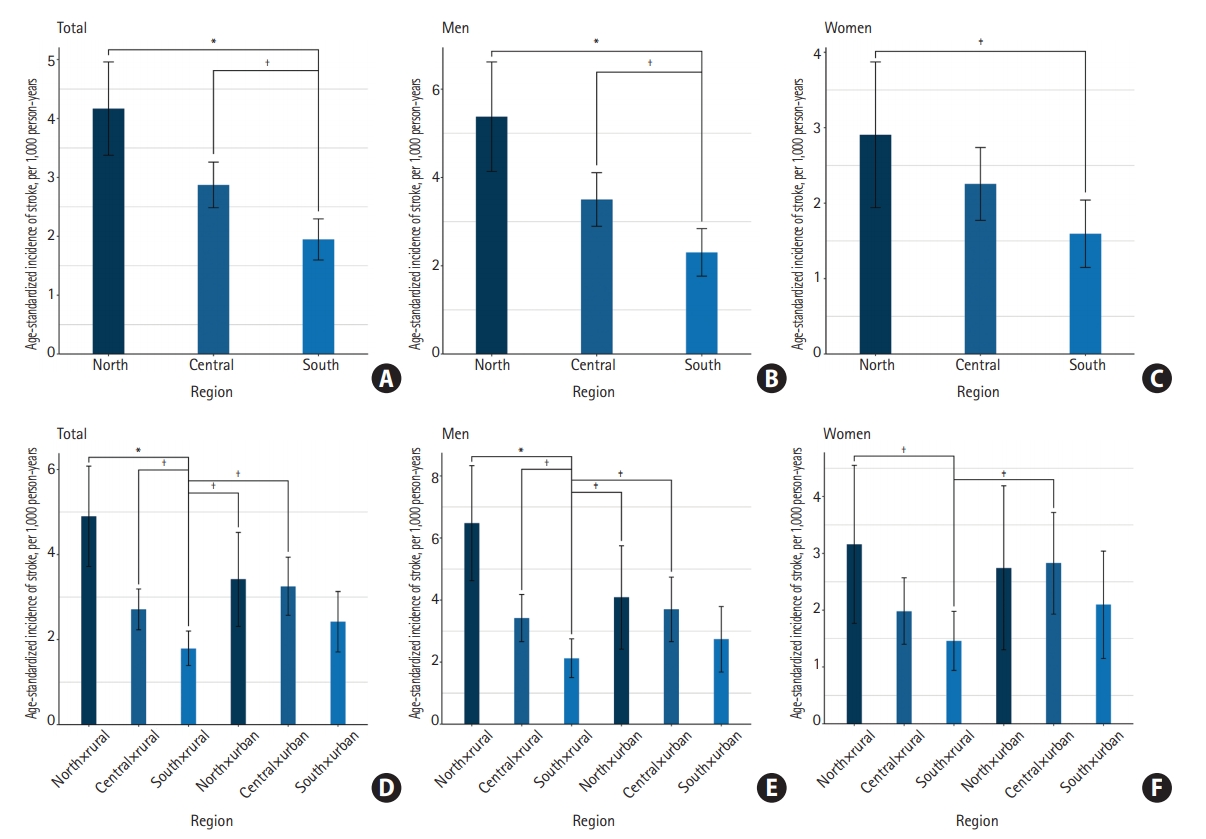
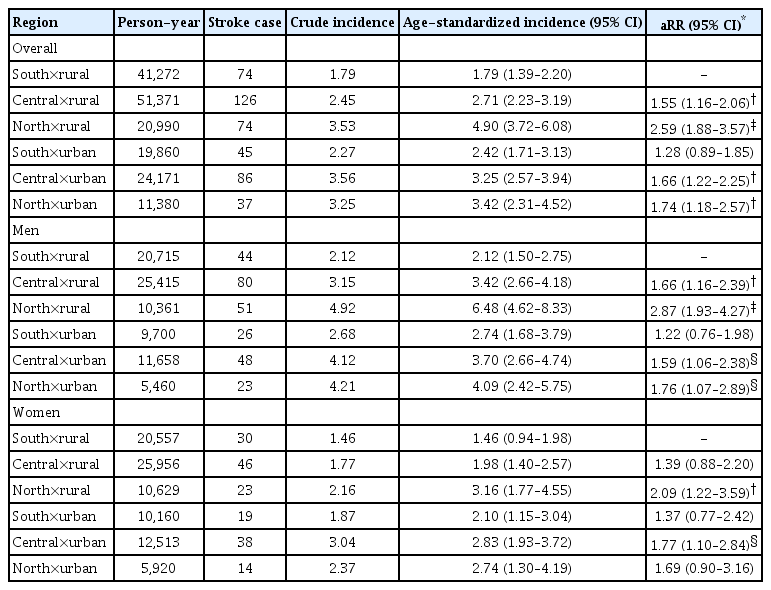
Figures 1 and 2 visualize the age-standardized incidence across regions (Supplementary Table 1). Table 2 provides additional information about the CIs and age-aRRs. During the study period, the age-standardized incidence of stroke ranged from 4.17 per 1,000 person-years (95% CI, 3.38% to 4.96) in the north region to 1.95 (95% CI, 1.60 to 2.30) in the south region (aRR, 2.04; 95% CI, 1.58 to 2.64; P<0.001). A similar pattern was observed in both men (central vs. south [aRR, 1.52; 95% CI, 1.14 to 2.03; P<0.01], north vs. south [aRR, 2.23; 95% CI, 1.62 to 3.08; P<0.05]) and women (north vs. south: aRR, 1.71; 95% CI, 1.12 to 2.63; P<0.05).

Age-standardized incidence across regions and urban vs. rural settings. Details and age-adjusted risk ratios are provided in Tables 2 and 3. (A-C) Age-standardized stroke incidence across regions, per 1,000 person-years. (A) In total; (B) among men; (C) among women. (D-F) Age-standardized stroke incidence across regions and urban vs. rural settings, per 1,000 person-years. (D) In total; (E) among men; (F) among women. South×rural represents rural areas in the south region. *P<0.001; †P<0.01; ‡P<0.05.
Table 3 and Figure 2 provide additional information about the north-to-south differences by urban-rural settings. Specifically, the age-standardized incidence among rural individuals in the north region (4.90; 95% CI, 3.72 to 6.08) was higher than their counterparts in the south region (1.79; 95% CI, 1.39 to 2.20; aRR, 2.59, 95% CI, 1.88 to 3.58, P<0.001). The north-to-south differences were observed in both rural men (central vs. south [aRR, 1.66; 95% CI, 1.16 to 2.39; P<0.01], north vs. south [aRR, 2.87; 95% CI, 1.93 to 4.27; P<0.05]) and women (north vs. south: aRR, 2.09; 95% CI, 1.22 to 3.59; P<0.01), whereas urban residents appeared to have similar age-standardized incidence across regions, as indicated by the overlapped 95% CIs of aRRs.
Extended Cox proportional hazards models
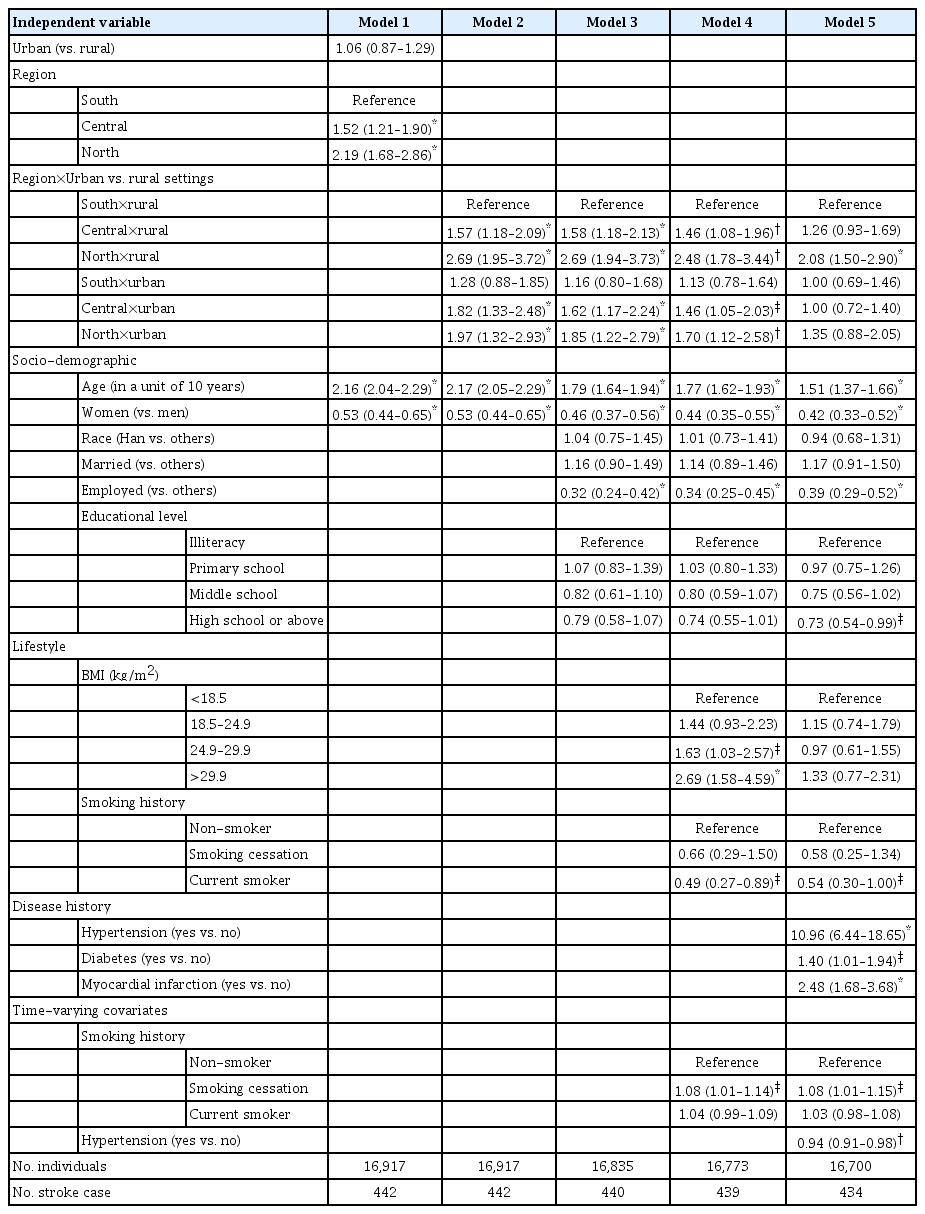
Table 4 provides results from hierarchical extended Cox proportional hazards analyses. In general, Models 1 and 2 were adjusted for age and sex; Model 3 was further adjusted for socioeconomic covariates; Model 4 was additionally adjusted for lifestyle attributes; and Model 5 was fully adjusted and included age, sex, socio-economic covariates, lifestyle attributes, and disease history.
Results from Model 1 in Table 4 indicated that individuals in the north (hazard ratio [HR], 2.19; 95% CI, 1.68 to 2.86) and central regions (HR, 1.52; 95% CI, 1.21 to 1.90) respectively had a higher risk of incident stroke in comparison with their counterparts in the south region. By comparing 95% CIs of the six combinations between regions and urban vs. rural settings, we found that the north-to-south differences did not exist in urban areas (Model 2 to 5). Results here were in line with those in Table 3.
In rural areas, the differences between the north and south regions remained consistent even in the fully adjusted model (Model 5, HR, 2.08; 95% CI, 1.50 to 2.90). In contrast, results from Models 4 and 5 indicated that in rural areas, the differences between the central and south regions (Model 4 [HR, 1.46; 95% CI, 1.08 to 1.96], Model 5 [HR, 1.26; 95% CI, 0.93 to 1.69]) could be fully explained by the disparities in the prevalence of hypertension and myocardial infarction. Having hypertension (Model 5, main effect, HR, 10.96; 95% CI, 6.44 to 18.65) and myocardial infarction (HR, 2.48, 95% CI, 1.68 to 3.68) were positively associated with incident stroke, although the effect of hypertension appeared to decrease over time (interaction effect, HR, 0.94; 95% CI, 0.91 to 0.98). Further analyses suggested that the disparities between the central and south regions were fully explained by the disparities in hypertension but not myocardial infarction (results not presented here).
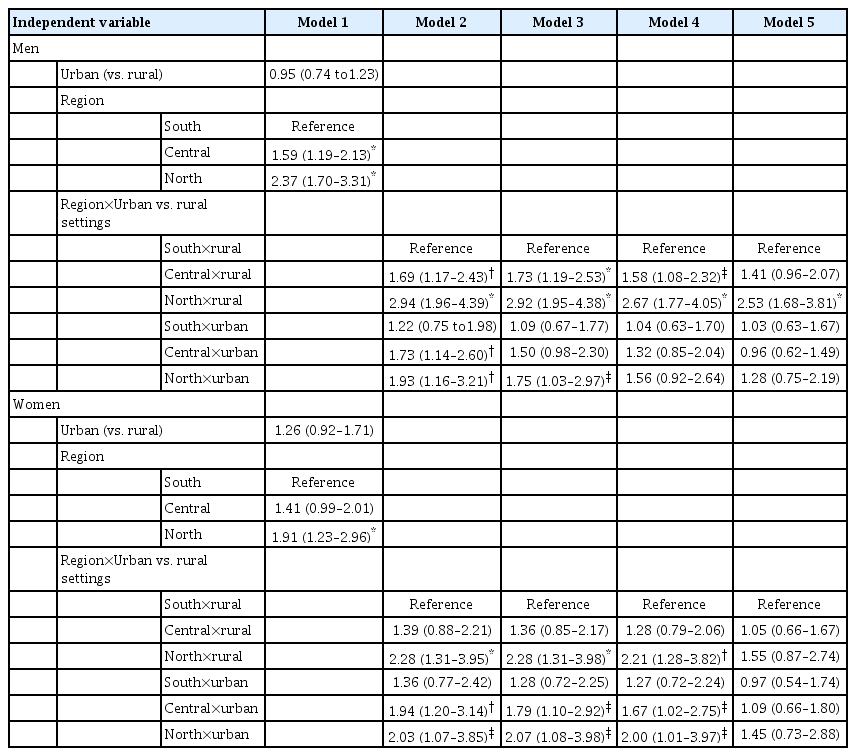
Subgroup analyses by sex (Table 5) shared the same hierarchical modelling process with pooled analyses. Consistent with the results in Table 3 and Figure 2, the differences between the central and south regions were only observed in men. The differences could be fully explained by the disparities in disease history, which were in line with the results in Table 4. Additionally, the north-to-south disparities among women were not statistically significant once the disease history was controlled. Likewise, further analyses among women suggested that the geographic variations were fully explained by the disparities in hypertension but not myocardial infarction (results not presented here).
Sensitivity analyses
Rate ratios from Poisson regression, odds ratios from logistics regression, and Mantel-Haenszel rate ratios were qualitatively similar to the age-aRRs from log-binomial regression. Results from sensitivity analyses that used dataset before imputation were consistent with those from our main analyses. Last, results from sensitivity analyses restricted to individuals with at least middle school education and aged under 65 years old (Supplementary Tables 2 and 3) were similar to the findings from the primary analyses.
Discussion
By employing a community-based cohort with 16,917 individuals, the present study extends the prior understanding of the regional disparities in stroke burden in China by focusing on the stroke incidence measure [4,6,7]. We found the north-to-south gradient only existed in rural areas but not in urban areas. In addition, our hierarchical modeling analyses based on a prospective cohort study-design indicated that the disparities in the prevalence of hypertension might account for the regional disparities. These findings help guide nationwide and regionspecific strategies for stroke prevention in China.
Comparison with existing research
Prior studies provided insufficient evidence on the interaction between the geographic gradient and urban-rural settings, even though the cross-sectional study based on a National Epidemiological Survey of Stroke in China (NESS-China) indicated a general north-to-south geographical gradient in stroke prevalence in conjunction with the heavy disease burdens in rural areas [7]. As urbanization has been accelerated over the past few decades, the regional differences among urban areas may have diminished over time [12]. Therefore, more attention should be directed to geographic disparities in rural areas when considering the priority of public health intervention.
Among rural areas between the north and south regions, we found that the disparities remained consistent even after controlling for potential stroke risk factors, including hypertension and myocardial infarction. In contrast to our findings, a higher stroke incidence was found in the southeastern United States, which has been widely acknowledged as ‘the Stroke Belt’ due to higher mortality of stroke in comparison with other regions [18-20]. Prior studies also indicated “the Stroke Belt” was a result of a significant number of rural residents, African American, residents with a higher prevalence of traditional stroke risk factors, inflammation and infection, as well as socio-economically deprived individuals [18,19,21-23]. However, it should be noted that findings from western nations may not be generalized to eastern countries since culture and social structure differ substantially. For instance, in our study, racial compositions (e.g., Han vs. others) were not associated with stroke incidence. Additionally, in comparison with those in the south region, individuals in high-risk north and central regions had a higher educational level, which, to some extent, represented higher socio-economic status (Table 1). These factors may explain the discrepancy between our results and the ‘Stroke Belt’ results in the United States. We further hypothesize that the disparities in the present study could be somewhat attributed to differences in alcohol consumption and dietary pattern. Earlier Chinese studies showed that in comparison with those in other regions, individuals in the northeastern region had a higher intake of alcohol and salt, which may be associated with an increased risk of stroke incidence in the northeastern region [7,24-26].
Among rural areas, we found that the disparities of stroke incidence between the central and south regions could be explained by disparities in hypertension. Our findings here were supported by an existing study, results of which indicated that the variations in stroke incidence were mainly yielded from the differences in the prevalence of hypertension [6]. Hypertension is well recognized as the most important and modifiable stroke risk factor [21]. In addition, we observed an interesting interaction between time and hypertension, indicating that the risk of hypertension declined during the study period. This finding appeared to suggest an improvement of hypertension management among the Chinese population, while subgroup analyses by sex (Supplementary Tables 4 and 5) indicated that the improvement only existed among women. Although public awareness and standardized treatment have improved quickly in China, current evidence has shown that the proportion of controlled hypertension (<20%) is still lower in comparison with developed countries [5,27]. Besides, many studies have pointed out that awareness, treatment, and control of hypertension are lower in rural areas [5-7,28], which suggests that the improvement in hypertension management in rural areas holds promise for stroke prevention in the future.
Our study confirmed that myocardial infarction history was significantly associated with incident stroke [4-7,13]. Notably, both acute myocardial infarction (e.g., left ventricular thrombus in the specific setting of an acute myocardial infarction) and chronic myocardial infarction together with reduced ejection fraction are considered to be high-risk cardiac sources of embolic strokes [29-31], which may account for the association between myocardial infarction and stroke in our study. In addition to management of hypertension as discussed above, coronary heart diseases, e.g., myocardial infarction, were poorly managed in China as well [5,7]. The burdens were also observed by studies from other countries [4,21]. As such, one should direct more attention among patients with myocardial infarction. Intervention strategies like anticoagulant therapy should be timely and appropriately applied for cardioembolic stroke prevention practice [32].
Strengths and limitations
Based on a prospective cohort study-design, the present study depicted the north-to-south gradient in stroke incidence across urban and rural China and provided robust estimates of the attributable risk factors that could account for regional disparities. The observed variations and potential attributable risk factors may provide clear and actionable implications for region-specific resources allocation.
Nonetheless, this study is subject to several limitations. First, our study did not identify the subtypes of stroke, and therefore our findings could not accurately reflect the conditions of ischemic and hemorrhagic stroke, respectively. Second, although we included individuals from China’s diverse communities, our findings could not reflect the general conditions among Chinese as CHNS did not include all provinces in China. Particularly, our findings could not reflect the conditions of provinces such as Inner Mongolia, Xinjiang, and Tibet, where the geographic contexts, culture, and socio-economic development differed from the provinces enrolled in the present study.
Meanwhile, non-ignorable bias exists because the stroke record was not missing completely at random. However, the small differences in missing rates across regions (<5%), would not substantially affect our main findings. Fourth, as a community-based survey, CHNS did not include institutionalized individuals, which not only diminished the representation of our study but also resulted in the potential underestimation of the incidence of stroke. Furthermore, self-reported outcome measures may lead to recall bias and could be affected by individuals’ educational level and disease awareness, while our sensitivity analyses restricted to younger individuals and those with a higher educational level accounted for the bias to some extent (Supplementary Tables 2 and 3).
Last, the present study is subject to the attrition bias as we are unable to analyze the deaths by deriving data from CHNS. In this regard, we may underestimate the incidence of stroke, particularly in underserved areas. Due to residents’ low health literacy and limited access to health care as well as untimely treatment, the mortality-to-incidence ratio of the first-ever stroke in underserved areas could be higher than that in economically developed areas [5,33]. However, by employing the national health claim data, the NESS-China study found that the mortality-to-incidence ratios were generally consistent in the vast majority of regions (ranging from 0.42 to 0.47), except the southwest region (0.68), where most of the provinces were not included in the present study [5,7]. Taken into account the small regional differences in mortality-to-incidence ratios, the attrition bias derived from deaths would not significantly affect the observed regional disparities in stroke incidence.
Conclusions
The present 18-year period prospective cohort study extends the current literature of the north-to-south gradient in stroke burden by focusing on the incidence measure. Higher risks were observed among rural residents in the north region in comparison with their counterparts in the south region. Focusing on the management of hypertension could greatly alleviate regional differences.
Supplementary materials
Supplementary materials related to this article can be found online at https://doi.org/10.5853/jos.2020.02383.
Study design and sample collection. *Three hundred and thirty-three observations from 118 individuals.
Crude and age-standardized incidence by provinces, per 1,000 person-years
Extended Cox proportional hazards analyses among individuals with at least middle school education, HR (95% CI)
Extended Cox proportional hazards analyses among individuals aged under 65, HR (95% CI)
Extended Cox proportional hazards analyses of stroke occurrence among men, HR (95% CI)
Extended Cox proportional hazards analyses of stroke occurrence among women, HR (95% CI)
Notes
Disclosure
The authors have no financial conflicts of interest.
Acknowledgements
This work is supported by the 1·3·5 project for disciplines of excellence-Clinical Research Incubation Project, West China Hospital, Sichuan University (grant number ZY2016102), and the project of the Sichuan Science and Technology Bureau (grant number 2017SZ0142).
We would like to thank Dr. Yi Li and Dr. Jian Kang from the Department of Biostatistics, School of Public Health, the University of Michigan, for suggestions in data analyses. We thank the China Center for Disease Control and Prevention and Carolina Population Center at the University of North Carolina at Chapel Hill for providing the CHNS data.


