Serum Neurofilament Light Chain Is Associated with Incident Lacunes in Progressive Cerebral Small Vessel Disease
Article information

Abstract
Background and Purpose
Serum neurofilament light (NfL)-chain is a circulating marker for neuroaxonal injury and is also associated with severity of cerebral small vessel disease (SVD) cross-sectionally. Here we explored the association of serum-NfL with imaging and cognitive measures in SVD longitudinally.
Methods
From 503 subjects with SVD, baseline and follow-up magnetic resonance imaging (MRI) was available for 264 participants (follow-up 8.7±0.2 years). Baseline serum-NfL was measured by an ultrasensitive single-molecule-assay. SVD-MRI-markers including white matter hyperintensity (WMH)-volume, mean diffusivity (MD), lacunes, and microbleeds were assessed at both timepoints. Cognitive testing was performed in 336 participants, including SVD-related domains as well as global cognition and memory. Associations with NfL were assessed using linear regression analyses and analysis of covariance (ANCOVA).
Results
Serum-NfL was associated with baseline WMH-volume, MD-values and presence of lacunes and microbleeds. SVD-related MRI- and cognitive measures showed progression during follow-up. NfL-levels were associated with future MRI-markers of SVD, including WMH, MD and lacunes. For the latter, this association was independent of baseline lacunes. Furthermore, NfL was associated with incident lacunes during follow-up (P=0.040). NfL-levels were associated with future SVD-related cognitive impairment (processing speed: β=–0.159; 95% confidence interval [CI], –0.242 to –0.068; P=0.001; executive function β=–0.095; 95% CI, –0.170 to –0.007; P=0.033), adjusted for age, sex, education, and depression. Dementia-risk increased with higher NfL-levels (hazard ratio, 5.0; 95% CI, 2.6 to 9.4; P<0.001), however not after adjusting for age.
Conclusions
Longitudinally, serum-NfL is associated with markers of SVD, especially with incident lacunes, and future cognitive impairment affecting various domains. NfL may potentially serve as an additional marker for disease monitoring and outcome in SVD, potentially capturing both vascular and neurodegenerative processes in the elderly.
Introduction
Neurofilament light (NfL)-chain is part of the neuroaxonal cytoskeleton and pathological processes causing neuroaxonal damage release NfL into the extracellular space, including peripheral blood. Therefore, given its abundance and specificity for neurons, NfL is an emerging blood-marker for neuroaxonal damage in various neurological diseases affecting the elderly, including neurodegenerative and cerebral small vessel disease (SVD) [1-3]. SVD is a frequent condition in the elderly and an important vascular contributor to dementia [4]. SVD-diagnosis is based on clinical and magnetic resonance imaging (MRI) measures, including white matter hyperintensities (WMHs), lacunes, and microbleeds [5]. However, there are potential limitations of MRI in the elderly and its availability. Thus, other more easily accessible markers, such as blood based markers reflecting the underlying condition, are warranted.
Recently, we observed elevated serum NfL-levels in individuals with SVD compared to healthy controls and cross-sectionally found a relation between NfL-levels and the severity of SVD-MRI-markers, especially with white-matter microstructural tissue damage as operationalized by mean diffusivity (MD) from diffusion-tensor-imaging [1]. Also, NfL-levels were strongly associated with impairment of processing speed performance, the cognitive domain most affected in SVD [1,6]. Therefore, serum NfL may potentially serve as a marker of disease progression in SVD, but longitudinal studies to address this are lacking. Here we therefore assessed the association of serum NfL-levels with the burden of future MRI-markers of SVD and cognitive impairment and dementia in a large cohort of patients with sporadic SVD.
Methods
Study population
The Radboud University Nijmegen Diffusion Tensor and Magnetic Resonance Imaging Cohort (RUN DMC) study is a prospective cohort study of 503 non-demented elderly with SVD, investigating risk factors and clinical consequences of SVD. The detailed protocol has been published previously [7]. The data that support the findings of this study are available from the corresponding author upon reasonable request.
Information on dementia status at follow-up was available for all 503 participants. Of all participants, 336 underwent repeated cognitive assessments at baseline (2006) and follow-up (2015), with a mean follow-up of 8.7±0.2 years. Of these, 264 participants completed MRI at follow-up [8]. Vascular risk factors (Table 1) have been described previously [1,7]. Hypertension was defined based on use of antihypertensives and guideline recommendations at baseline. Diabetes and hypercholesterolemia were considered to be present if the participant was taking antidiabetic or lipid-lowering drugs. The smoking status and alcohol consumption were obtained through questionnaires. Body mass index was calculated as weight divided by height squared. Depressive symptoms were assessed using the Center for Epidemiologic Studies Depression Scale (CES-D). The Medical Ethics Committee region Arnhem-Nijmegen approved the study, participants gave written informed consent.

Baseline characteristics
Neurofilament-analysis and MRI
Details regarding the NfL-assay and the neuroimaging-protocol have been previously published [1,7-9]. In brief, for serum-NfL analysis all samples were analyzed on the same single molecule array instrument (Simoa HD-1, Quanterix, Lexington, MA, USA) in Basel. We used the capture monoclonal antibody (mAB) 47:3, and the biotinylated detector mAB 2:1 (UmanDiagnostics, Umeå, Sweden) [10], transferred onto the Simoa platform. Bovine lyophilized NfL was obtained from UmanDiagnostics. Calibrators ranged from 0 to 2,000 pg/mL. Intra- and inter-assay variability of the assay were below 20%, respectively. The analytical sensitivity was 0.32 pg/mL. All samples produced signals above the analytical sensitivity of the assay.
MRI images were acquired at three time points on 1.5-TeslaMRI, though only the two MRI assessments from baseline and final follow-up were used in the present study. The following measures were assessed at both timepoints: total brain volume, gray/white matter volume, WMH-volume, MD, fractional anisotropy (FA), lacunes, and microbleeds (Supplementary Table 1).
WMH-volumes were calculated as the sum of all voxels designated as WMH multiplied by the voxel volume in mL; WMH-volumes were checked for segmentation-errors by one trained rater, lacunes, and microbleeds were rated manually on fluid-attenuated inversion recovery (FLAIR)/T1-weighted and T2*-weighted MRI by two trained raters, all blinded for clinical data. Inter-/intra-rater reliability were excellent [9]. The segmented WMH maps were resampled and registered to the white matter maps in order to obtain WMH maps and normal-appearing white matter (NAWM; e.g., white matter not containing WMH) maps.
Cerebral microbleeds were assessed on T2*-weighted gradient echo sequence with same protocol parameters for all time points (time repetition=800 ms, time echo=26 ms, voxel size 1.3×1.0×5.0 mm, interslice gap 1.0 mm). We used the same head coils at all three time points. The intra- and inter-rater variability were good with weighted kappa’s of 0.87 and 0.95 for lacunes and 0.85 and 0.86 for microbleeds, calculated in 10% of the scans. Volumes (mL) were corrected for interscan differences in intracranial volume (ICV) and normalized to baseline ICV. Diffusion-weighted-images were denoised and corrected. Diffusion-tensor and scalar parameters (MD/FA), were calculated using DTIFIT from FSL’s FDT toolbox. The segmented WMH maps were resampled and registered to the white matter maps in order to obtain WMH maps and NAWM (e.g., white matter not containing WMH) maps.
Median time between blood-sampling and baseline MRIscan was 14 days (mean±standard deviation [SD], 19±32 days). Samples were aliquoted in polypropylene vials and stored deep-frozen until analysis (performed 2018).
Dementia status
Dementia case finding was described previously [11]. In short, dementia was diagnosed after examination at the Radboud Alzheimer Center or by expert panel consensus diagnosis. Age and education were considered for interpretation, next to interference with daily living, confirmed by family/caregivers. In total, 65 out of 503 participants were diagnosed with dementia during follow-up.
Cognitive function
Cognitive performance was measured using an extensive neuropsychological test battery, as has been described previously [12]. In short, the test battery included the Mini-Mental State Examination (MMSE), Rey Auditory Verbal Learning Test (RAVLT), Rey Complex Figure Task (RCFT), verbal fluency, Paper-Pencil Memory Scanning Task (PPMST), Stroop Color Word Test (short form), Symbol Digit Substitution Task (SDST), and Verbal Series Attention Test (VSAT). To account for possible learning effects, parallel versions of the RAVLT, RCFT, and verbal fluency task were used for the follow-up assessment. Raw scores of all time-points were transformed into z-scores based on the mean±SD of the overall study population at baseline. We calculated speed-accuracy trade-off (SAT) scores where appropriate. Cognitive decline over time was calculated for each subject individually, by subtracting baseline scores from the follow-up scores.
We calculated compound scores for global cognitive function, memory, processing speed, and executive function. We calculated the cognitive index as a compound score for global cognitive function, using the mean of the z-scores of all tests from the neuropsychological test battery. Z-scores for both baseline and follow-up were calculated using the mean±SD of the baseline tests. Higher z-scores always indicate a better performance. Change in cognitive functioning for separate cognitive domains was calculated within-subject, by subtracting the baseline domain compound score from the follow-up domain compound score.
Memory was measured using the two-letter and three-letter subtasks of the PPMST and the immediate and delayed recall of the RAVLT and the RCFT. Processing speed was calculated as the mean of the z-scores of the one-letter subtask of the PPMST, the reading and color naming tasks of the stroop test and the SDST. Executive function was measured using the verbal fluency task, the interference score of the stroop test, which was calculated by dividing the color-word task by the mean of the reading and color naming tasks of the stroop test, and the VSAT.
Statistics
Statistical analyses were performed using SPSS Statistics version 20 (IBM Co., Armonk, NY, USA). Serum-NfL and WMH-volumes were log-transformed because of skewedness. Associations between baseline NfL (independent variable) and MRImarkers (dependent variables) were analyzed by linear regression analyses. Associations between NfL and (incident) lacunes and microbleeds were calculated by analysis of covariance (ANCOVA). Analyses for lacunes and microbleeds were performed based on (1) presence or absence of the respective lesion; (2) quantitative categorization according to the number of the respective lesion into four groups: 0, 1, 2 to 4, 5 or more.
We adjusted for age, sex, hypertension, and the respective variable at baseline. For cognitive measures we performed linear regression analyses. Cox-proportional-hazard analyses were performed for association between NfL-levels and development of dementia.
Results
Baseline characteristics and analysis
Baseline characteristics are presented in Table 1. Participants for whom follow-up MRI and/or cognitive testing was available were slightly younger and had less severe MRI-markers of SVD than the overall RUN DMC-cohort. Median level of serum NfL in the two subgroups did not significantly differ from the overall cohort. In accordance with the overall cohort [1], NfL-levels were associated with WMH-volume, MD, lacunes, and microbleeds at baseline in the subgroup with follow-up MRI (Tables 2 and 3). Association with lacunes and microbleeds at baseline remained significant when categorizing the lesions according to their numbers (lacunes: β=0.36, P<0.001; microbleeds: β=0.16, P=0.013).

Associations between NfL levels and MRI markers of SVD in patients with follow-up

Serum NfL levels at baseline in SVD patients with or without lacunes and microbleeds
NfL-levels were significantly higher in subjects with lacunes (mean 122.3 pg/mL) versus without lacunes (59.7 pg/mL; P<0.0001). NfL-levels were associated with processing speed (P<0.001), cognitive index (P=0.001), and memory function (P=0.016) at baseline for the subgroup with cognitive follow-up, adjusted for age, sex, education, and depression (Table 4).
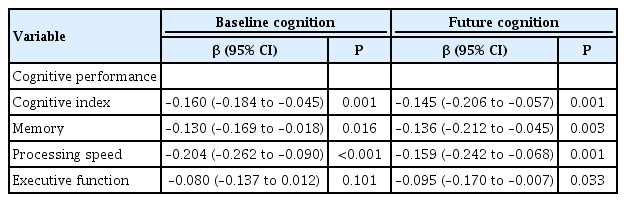
Associations between baseline NfL levels and cognitive performance in patients with follow-up
Changes of MRI and cognitive measures over time
Changes in MRI-markers of SVD and cognitive performance over time are shown in the Supplementary Table 1: SVD-related MRI-markers showed progression during follow-up (P<0.001). This was also the case for cognitive performance. No difference of progression regarding both, MRI-measures and cognition, was observed in subjects with or without antithrombotic medication.
Association of NfL with MRI-markers at follow-up
Serum NfL levels were associated with WMH-volume (β=0.173; 95% confidence interval [CI], 0.062 to 0.327; P=0.004) and MD (β=0.165; 95% CI, 0.048 to 0.334; P=0.009) at follow-up, after adjustment for age and sex (Table 2). This association was however not significant after additional adjustment for the respective baseline MRI-measure. We did not observe an association of NfL with changes of WMH-volume or MD over time.
NfL-levels were associated with lacune number at follow-up and incident lacunes during the follow-up period after adjustment for age and sex (P<0.001) (Table 3). This was also the case when categorizing lacunes according to their number (β=0.32, P<0.001). The association with incident lacunes remained significant after adjustment for baseline lacunes, also in the quantitative categorization (P=0.040).
Association of NfL with cognition and dementia at follow-up
NfL was associated with cognitive index (P=0.001), memory (P=0.003) as well as processing speed (P=0.001) and—in contrast to baseline—also with executive function (P=0.033) at follow-up, independent of age, sex, educational level, and depression (Table 4). This association was, however, not independent of the respective cognitive measure at baseline. NfL-levels were higher in participants who developed dementia during follow-up (n=65; NfL 74.8 pg/mL) versus those without dementia (n=438; 50.1 pg/mL; P<0.001). However, this difference disappeared when adjusting for age. The risk of developing dementia was increased with higher NfL-levels (hazard ratio [HR], 5.0; 95% CI, 2.6 to 9.4; P<0.001), but again significance was lost after adjusting for age (HR, 1.6; 95% CI, 0.6 to 4.1; P=0.312).
Discussion
In subgroups from the RUN DMC-study with a 9-year followup, we here found serum NfL to be associated with incident lacunes in cerebral SVD, thus indicating disease progression. Recent studies have identified other biomarkers, such as markers of inflammation and hemostasis to be associated with imaging markers of SVD progression [13-15]. Serum NfL may be of additional value as a blood based marker of SVD progression, given its association with both, imaging lesion-burden and cognitive performance [1].
Serum NfL was significantly higher in subjects with versus those without lacunes at baseline and was related to the presence and number of lacunes at follow-up as well as with the occurrence of incident lacunes during follow-up, independent of baseline lacune number.
Besides WMH, lacunes are a hallmark of SVD and the occurrence of lacunes is known to be of clinical relevance in SVD [16]. Silent lacunes are associated with mild neuropsychological deficits in subjects with first-ever lacunar stroke [17]. Lacunes occur in a temporo-spatial relation to WMH, appearing later and mostly at the edge of WMH [18]. Our finding is in line with this course of tissue damage in SVD and with previous reports on NfL being sensitive to active SVD [3] and on NfL predicting lacunar cavitation in small subcortical infarcts [19]. Serum NfL is a circulating marker for neuroaxonal damage, thus reflecting altered structural integrity of axons and therefore a rather severe disease state. In SVD it is known that a higher baseline severity is associated with a more progressive course [8]. Our results indicate that serum NfL represents this disease severity in SVD, indicating an active and potentially progressive course of the disease associated with the occurrence of incident lacunes.
NfL was furthermore associated with WMH volume and MD at follow-up, independent of age and sex. However, this association was not independent of the respective imaging measure at baseline. The latter is overall not surprising, given the strong cross-sectional association of NfL with lesion burden at baseline [1], indicating that NfL reflects disease severity captured by MRI. Serum NfL may thus be regarded as an additional marker to the MRI markers also capturing the extend of pathology related to SVD.
We found NfL to be associated with processing speed, independent of age and after adjustment for MD, which is an underlying substrate of vascular cognitive impairment in SVD. NfL thus also seems to be a sensitive marker of vascular neuroaxonal damage, reflecting the disease process underlying cognitive impairment in SVD. However, again, the association was not observed when adjusting for the respective cognitive test at baseline. Therefore, NfL cannot be regarded as an independent, but rather an additional marker of cognitive impairment, in line with our findings for WMH and MD.
Independently of relevant variables, including age, education, and depression, NfL was associated with future cognitive impairment in the group with follow-up, including processing speed, the domain most affected in SVD [1,6], and—in contrast to baseline—also executive function, which is also known to be an affected domain in SVD [6,20], therefore potentially indicating disease progression. The broader association with other domains, including global cognitive index and memory performance may suggest that NfL overall does not only reflect vascular, but also neurodegenerative pathologies associated with aging, as also previously shown in other studies [2,21-24]. A recent study from our cohort showed that memory decline in elderly with SVD is best explained by the interaction of white matter damage and hippocampal volume, suggesting that memory decline observed in subjects with SVD is heterogeneous process [11]. However, in our study we did not identify serum NfL to be an independent marker of cognitive decline. Therefore, further studies in independent cohorts are needed to further address role of NfL as a potential predictor of future cognitive deterioration. Importantly, our results indicate that—when studying the role of NfL in neurodegenerative disease—concomitant cerebral SVD should be taken into account.
Limitations of our study are the lack of NfL-values at followup, thus not allowing to study the temporal course of NfL-levels. Different MRI-scanning/sequences at the timepoints potentially caused segmentation-differences. However, this is unlikely based on previous validation by repeating analyses for all time-periods within the RUN DMC-cohort [25]. Finally, given the long-term follow-up, some—especially more affected participants—could not complete the follow-up. However, this attrition bias most likely results in underestimation of our findings, having potentially missed more severe lesion burden.
The strengths are the large cohort and longitudinal design over approximately 9 years and the comprehensive and standardized clinical and imaging work-up. Measurements of NfL was performed at an experienced centre using a very sensitive state-of-the art Simoa assay.
Conclusions
Serum NfL was associated with future MRI measures and especially the occurrence of incident lacunes in SVD and may potentially be of additional value for disease monitoring and outcome, reflecting disease severity as well as progression in SVD. There was an independent association of NfL also with future cognitive impairment related to SVD. The overall association with a broader spectrum of cognitive impairment may indicate that NfL reflects both vascular and neurodegenerative processes in the elderly.
Supplementary materials
Supplementary materials related to this article can be found online at https://doi.org/10.5853/jos.2019.02845.
MRI markers and cognitive performance over time
Notes
Disclosure
The authors have no financial conflicts of interest.
Acknowledgements
Frank-Erik de Leeuw is supported by an investigator grant of the Dutch Heart Foundation and by a VIDI innovational grant from The Netherlands Organisation for Health Research and Development. Furthermore, this study was supported by the Neurology Research Pool, University Hospital Basel. Anil M. Tuladhar is supported by a junior staff member grant of the Dutch Heart Foundation (grant number 2016 T044).