Perfusion and Diffusion Variables Predict Early Neurological Deterioration in Minor Stroke and Large Vessel Occlusion
Article information

Abstract
Background and Purpose
Patients with acute large vessel occlusion (LVO) presenting with mild stroke symptoms are at risk of early neurological deterioration (END). This study aimed to identify the optimal imaging variables for predicting END in this population.
Methods
We retrospectively analyzed 94 patients from the prospectively maintained institutional stroke registry admitted between January 2011 and May 2019, presenting within 24 hours after onset, with a baseline National Institutes of Health Stroke Scale score ≤5 and anterior circulation LVO. Patients who underwent endovascular therapy before END were excluded. Volumes of Tmax delay (at >2, >4, >6, >8, and >10 seconds), mismatch (Tmax >4 seconds – diffusion-weighted imaging [DWI] and Tmax >6 seconds – DWI), and mild hypoperfusion lesions (Tmax 2–6 and 4–6 seconds) were measured. The association of each variable with END was examined using receiver operating characteristic curves. The variables with best predictive performance were dichotomized at the cutoff point maximizing Youden’s index and subsequently analyzed using multivariable logistic regression.
Results
END occurred in 39.4% of the participants. The optimal variables were identified as Tmax >6 seconds, Tmax >6 seconds – DWI, and Tmax 4–6 seconds with cut-off points of 53.73, 32.77, and 55.20 mL, respectively. These variables were independently associated with END (adjusted odds ratio [aOR], 12.78 [95% confidence interval (CI), 3.36 to 48.65]; aOR, 5.73 [95% CI, 2.04 to 16.08]; and aOR, 9.13 [95% CI, 2.76 to 30.17], respectively).
Conclusions
Tmax >6 seconds, Tmax >6 seconds – DWI, and Tmax 4–6 seconds could identify patients at high risk of END following minor stroke due to LVO.
Introduction
Patients presenting with mild symptoms of acute ischemic stroke are common and account for approximately half of all patients [1,2]. Despite the perception that minor stroke is a benign condition, nearly one-third of patients have persistent disability [3-5]. In particular, up to 30% of minor strokes are caused by acute large vessel occlusion (LVO) [1,6], and affected patients are at high risk of early neurological worsening and poor longterm outcomes [7,8].
Whether endovascular therapy (EVT) is beneficial in minor stroke due to LVO is uncertain, as most large clinical trials for EVT excluded patients with a National Institutes of Health Stroke Scale (NIHSS) score of 5 or less [9-15], and several retrospective studies have reported contradictory results on the effects of EVT in minor stroke [6,16-22]. Therefore, it is crucial to identify patients who are most likely to benefit from EVT in minor stroke with LVO.
Over half of minor stroke patients with LVO who were medically treated showed excellent outcomes at 3 months [6,18-22] and appear to be inappropriate for EVT. Meanwhile, patients who experience neurological worsening during best medical treatment show less favorable outcomes than those undergoing immediate EVT, even if they receive rescue EVT following clinical deterioration [6,20,21]. Thus, identifying patients who are likely to have early neurological deterioration (END) is clinically important, as immediate EVT may be considered as one of the treatment options in this patient group.
Infarct growth in the same vascular territory is the most common mechanism of END [23]. Theoretically, the transition from oligemic tissue to a functionally impaired state may lead to clinical deterioration. Based on this theory, those with a larger area of non-infarcted but hypoperfused tissue may be at greater risk of developing END. Imaging variables from perfusion-weighted imaging (PWI) and diffusion-weighted imaging (DWI) could be potential surrogate markers for hypoperfused brain regions. Using these variables, several studies have demonstrated that mismatch between PWI and DWI is associated with infarct growth [24] and poor outcomes, including END [25,26]. However, due to the heterogeneity of study participants in previous studies, whether these imaging variables predict END in patients with LVO presenting with mild symptoms remains unknown. We aimed to investigate the optimal imaging variables using PWI and DWI for the prediction of END in this population.
Methods
Study population
We retrospectively reviewed consecutive patients with ischemic stroke from our prospectively maintained institutional stroke registry. We identified patients who met the following inclusion criteria: (1) admission to Kyungpook National University Hospital between January 2011 and May 2019 (n=7,945); (2) arrival within 24 hours of the last known normal (n=5,465); (3) baseline NIHSS score of five or less (n=3,001); (4) pre-stroke modified Rankin Scale (mRS) of 0 or 1 (n=2,705); and (5) acute LVO in the anterior circulation (defined by occlusion of the intracranial internal carotid artery, proximal segment of the middle cerebral artery [M1 or M2 trunk], or tandem occlusion) documented on the initial computed tomography angiography or magnetic resonance angiography (n=158). Patients with LVO due to moyamoya disease were excluded (n=15). Patients were also excluded if they were treated with EVT before END (n=14) or did not undergo PWI (n=35). Finally, 94 patients were eligible for analysis (Supplementary Figure 1). The study protocol was approved by the Institutional Review Board (IRB approval number: KNUH 2020-04-001). The need for informed consent was waived due to the retrospective nature of the study and the minimal risk to study participants. All study participants were fully anonymized.
Data collection
Baseline demographics and clinical characteristics were obtained from the institutional stroke registry database or through a review of electronic medical records. The following variables were collected: age, sex, baseline NIHSS score, onset-to-door time, pre-stroke mRS, stroke mechanism classified according to the Trial of ORG 10172 in Acute Stroke Treatment (TOAST) criteria with some modifications [27], occluded vessel location, hypertension, diabetes mellitus, hyperlipidemia, atrial fibrillation, myocardial infarction or angina, history of smoking, baseline blood pressure, type of recanalization therapy, and laboratory data including baseline leukocyte count, hemoglobin, hematocrit, platelet count, erythrocyte sedimentation rate, C-reactive protein, fibrinogen, and glucose level.
Ischemic core lesions identified on DWI were measured using an automated software program with minimal manual editing (Olea Sphere 3.0, SP6, Olea Medical, La Ciotat, France). Dynamic susceptibility PWI was performed, and the Tmax value of the residue function generated by deconvolution was obtained. The Tmax delay volumes (Tmax >2, 4, 6, 8, and 10 seconds) were measured using the same program. The Tmax delay lesion of the optimal threshold was determined as a critical hypoperfusion lesion reflecting its association with neurological worsening. Mismatch volumes (Tmax >4 seconds – DWI volume and Tmax >6 seconds – DWI volume) and mild hypoperfusion lesions where perfusion deficits were milder than the penumbra [28,29] (Tmax 2–6 seconds and Tmax 4–6 seconds) were also recorded.
The outcome variables, including END and unfavorable functional outcome (defined as an mRS of 2 to 6) at 3 months were collected. To capture neurological worsening sensitively and exclude systemic causes, we defined END as any new neurological symptom or any neurological worsening with an increase in the total NIHSS score of 2 or more, or an increase in the motor score (5a-6b) of one or more within 72 hours of stroke onset [30-32]. It was immediately documented by the onduty neurologist or attending physician.
Statistical analysis
Data are summarized as number (%), mean±standard deviation, or median (interquartile range [IQR]). Comparisons of variables between the groups with or without END were made using Student’s t-test or the Mann-Whitney U test for continuous variables, and Pearson’s chi-square test or Fisher’s exact method for categorical variables, as appropriate. In addition, the association of END with unfavorable outcomes was tested using Pearson’s chi-square test.
The optimal threshold for the Tmax delay lesion was defined as that showing the best predictive performance for END and was determined using receiver operating characteristic (ROC) curve analysis. For the variables of mismatch volume and mild hypoperfusion lesions of each Tmax threshold, the optimal threshold was also obtained in the same way. Furthermore, these continuous variables were dichotomized at the cutoff point maximizing Youden’s index (sensitivity+specificity–1) [33]. The best thresholds of Tmax delay lesion (critical hypoperfusion lesion), mismatch volume, and mild hypoperfusion lesion were subsequently analyzed to derive predictive models using multivariable logistic regression analysis.
Univariable logistic regression analyses were performed to examine the associations of critical hypoperfusion lesions, mismatch volumes, and mild hypoperfusion lesions with clinical outcomes. All variables that were different between the two groups (defined as P<0.1) were then included in the backward stepwise multivariable logistic regression analyses to adjust for the effects of confounding variables. To avoid multicollinearity among the imaging variables, critical hypoperfusion lesions, mismatch volumes, and mild hypoperfusion lesions were tested in separate models. A two-sided P-value <0.05 was considered statistically significant. All statistical analyses were performed using SPSS version 25.0 (IBM Co., Armonk, NY, USA).
Results
A total of 94 patients with acute LVO presenting with mild symptoms were included in this study. Among them, 37 (39.4%) patients experienced END. In all cases, the mechanism of END was progressive stroke in the same vascular territory. Baseline demographics and clinical characteristics are shown in Table 1. We found no statistical difference in the baseline characteristics between the groups with or without END, except for onset-to-door time and type of recanalization therapy. The onset-to-door time (hours) was shorter in patients with END (2.50 [IQR, 1.45 to 9.33]) than in those without END (4.28 [IQR, 1.58 to 13.67]; P=0.019). Patients who experienced END were more frequently treated with intravenous tissue-type plasminogen activator (tPA; 54.1%) than patients without END (14.0%; P<0.001). The PWI and DWI variables are presented in Table 2. Initial hypoperfusion lesion volumes with a Tmax threshold of >4, >6, >8, and >10 seconds were larger in the END group than in the non-END group. Mismatch volumes with a Tmax threshold >4 and >6 seconds and mild hypoperfusion lesion of Tmax 4–6 seconds were also larger in the END group. Patients with END were more likely to have an unfavorable outcome at 3 months than those without END (35.1% vs. 7.0%, P=0.001). Of the patients with END, 62.2% (23/37) received EVT following neurological worsening (Table 1). However, 30.4% (7/23) of these patients showed unfavorable outcomes at 3 months despite rescue EVT.
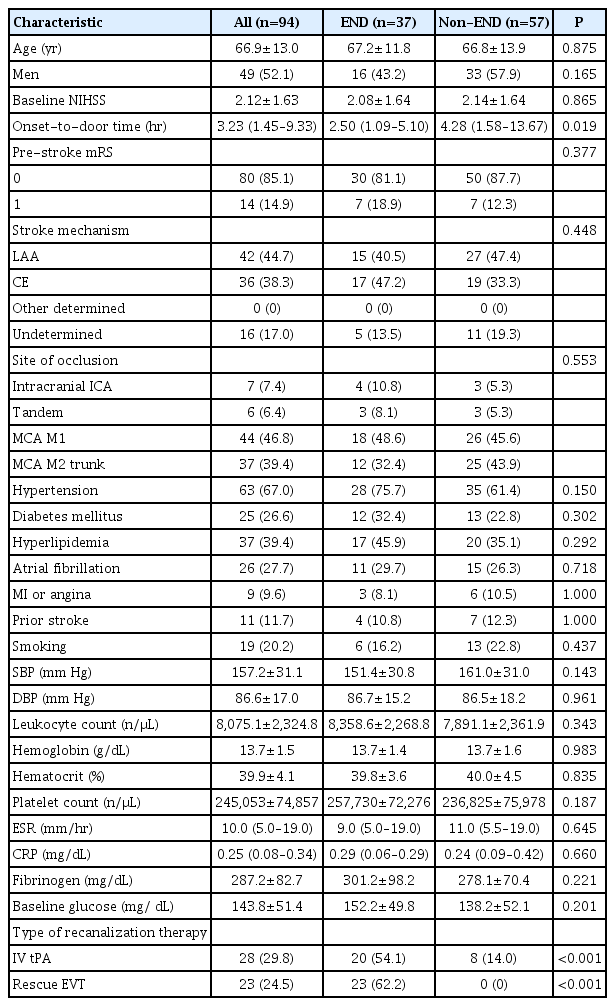
Baseline characteristics of the patients

Perfusion- and diffusion-weighted imaging variables
The ROC analysis of imaging variables for each threshold and their association with END identified Tmax >6 seconds, Tmax >6 seconds – DWI, and Tmax 4–6 seconds as the optimal values for further analysis (area under the curve=0.725 [95% confidence interval (CI), 0.622 to 0.829; P<0.001]; 0.753 [95% CI, 0.654 to 0.852; P<0.001]; and 0.648 [95% CI, 0.535 to 0.762; P=0.016], respectively). Based on Youden’s Index, the optimal volume of Tmax >6 seconds for predicting END was ≥53.73 mL, Tmax >6 seconds – DWI was ≥32.77 mL, and Tmax 4–6 seconds was ≥55.20 mL (Table 3).
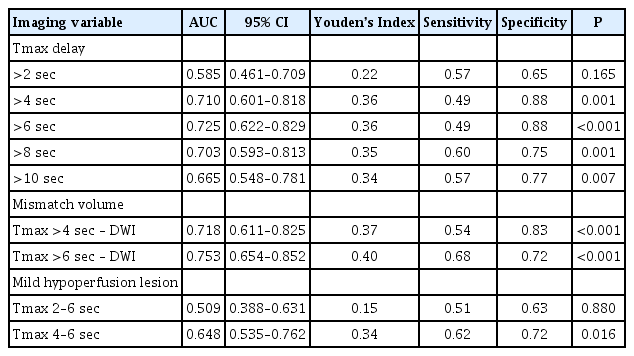
Receiver operating characteristic curve analysis of imaging variables of each threshold for predicting early neurological deterioration
In the univariate logistic regression analysis, patients who had a Tmax >6 seconds of ≥53.73 mL (the group with a large critical hypoperfusion lesion volume) were more likely to experience END than those with a Tmax >6 seconds of <53.73 mL (odds ratio [OR], 6.77; 95% CI, 2.44 to 18.77; P<0.001) (Table 4). In addition, patients who had a mismatch volume ≥32.77 mL (the mismatch pattern group) and mild hypoperfusion lesion of Tmax 4–6 seconds ≥55.20 mL (the group with a large mild hypoperfusion lesion volume) were more likely to experience END (OR, 5.34 [95% CI, 2.17 to 13.11; P<0.001] and 4.21 [95% CI, 1.75 to 10.15; P=0.001], respectively). Due to the multicollinearity of these variables, each imaging variable was tested in a separate multivariable logistic regression model. In model 1, adjusting for the difference in variables between the two groups, patients with large critical hypoperfusion lesion volumes were still significantly more likely to experience END (adjusted OR [aOR], 12.78; 95% CI, 3.36 to 48.65; P<0.001). Furthermore, the association between the mismatch pattern and END remained significant in model 2 (aOR, 5.73; 95% CI, 2.04 to 16.08; P=0.001). In model 3, patients with large mild hypohypoperfusion lesion volumes were independently associated with END (aOR, 9.13; 95% CI, 2.76 to 30.17; P<0.001). Those who received tPA also showed an independent association with END in all models.
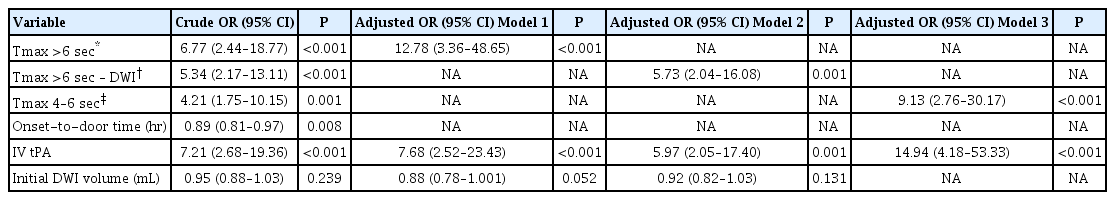
Logistic regression analysis investigating the association between clinical and imaging variables and early neurological deterioration
Large critical hypoperfusion lesion volume, mismatch pattern, and large mild hypoperfusion lesion volume were associated with increased odds of an unfavorable outcome at 3 months (OR, 11.82 [95% CI, 3.55 to 39.29; P<0.001]; OR, 5.69 [95% CI, 1.69 to 19.13; P=0.005]; and OR, 4.44 [95% CI, 1.42 to 13.95; P=0.011], respectively) (Table 5). We also found that these variables were independently associated with an unfavorable outcome at 3 months, even after adjusting for confounding variables (aOR, 23.72 [95% CI, 4.79 to 117.47; P<0.001]; aOR, 12.47 [95% CI, 2.43 to 64.09; P=0.003]; and aOR, 5.61 [95% CI, 1.56 to 20.19; P=0.008], respectively). Other variables, including pre-stroke mRS in all three models and baseline glucose in models 2 and 3, were independent predictors of an unfavorable outcome at 3 months.
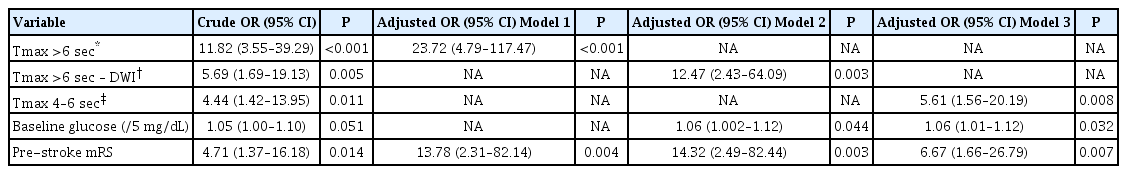
Logistic regression analysis investigating the association between clinical and imaging variables and 3-month unfavorable outcome
Discussion
This study shows that END occurs frequently (39.4%) in patients with minor stroke and LVO. The optimal imaging variables for predicting END were Tmax >6 seconds, Tmax >6 seconds – DWI, and Tmax 4–6 seconds, respectively. Specifically, large critical hypoperfusion lesion volume (Tmax >6 seconds ≥53.73 mL), mismatch pattern (Tmax >6 seconds – DWI ≥32.77 mL), and large mild hypoperfusion lesion volume (Tmax 4–6 seconds ≥55.20 mL) were associated with END. These imaging variables were also associated with unfavorable functional outcomes at 3 months.
Previous studies have demonstrated that a mismatch volume or ratio was associated with END [25,26]. However, these studies enrolled patients regardless of LVO, and one included a patient with relatively severe stroke with an NIHSS score of ≥6 [25]. Accordingly, optimal imaging variables predicting END in minor stroke and LVO remain unknown. Although a recent study failed to find radiological predictors of END in a similar patient population, patients with END tended to have larger Tmax >6 seconds lesion volumes [34], which is in line with our findings. The current and earlier studies suggest that critical hypoperfusion lesions on magnetic resonance imaging would reliably reflect collateral status [35,36], which is an important determinant of fluctuations of neurological status [37-39]. In addition, our results suggest that mismatch lesions and mild hypoperfusion lesions could be another predictor of END, and these lesions are at risk of progressing to the infarct core in patients with minor stroke and acute LVO. Patients treated with tPA were also independently related to END. However, the results should be interpreted with caution. As treatment strategies were determined at the discretion of the attending physicians, patients expected to have poorer outcomes may have had a higher chance of receiving tPA. Although not statistically significant, patients who received tPA had larger Tmax >6 seconds and Tmax >6 seconds – DWI volume than those who did not. Furthermore, patients treated with tPA had shorter onset-to-door times and thus received medical attention for a longer time, and thus had a higher chance of neurological worsening being detected by physicians (Supplementary Table 1) [32].
Given the association between END and perfusion status in patients with minor stroke and acute LVO, restoration of perfusion deficits might be considered as a potential treatment strategy for patients at high risk of END. Since delaying EVT until neurologic worsening appears to reduce its beneficial effect [6,20,21], immediate EVT might be considered in cases of minor stroke and LVO with a large critical hypoperfusion lesion volume, mismatch pattern, or a large mild hypoperfusion lesion volume. Further well-designed clinical trials should be conducted to prove the benefit of immediate EVT in minor stroke patients with a high risk of END.
Our study has several limitations. Due to its retrospective design, selection bias cannot be ruled out. Patients who were deemed to have neurological worsening were possibly treated with immediate EVT and excluded from this study (n=14). They had a larger mismatch volume between Tmax >6 seconds and DWI (median 51.98 mL [IQR, 25.61 to 129.21]) and Tmax >6 seconds lesion volume (62.33 mL [IQR, 10.15 to 56.67]) (Supplementary Tables 2 and 3). Despite this bias, END was frequent (39.4%) in our study cohort. Another shortcoming may be unmeasured confounders. Further, as the perfusion status of each tissue may dynamically change over time in the acute stage of stroke [40], a single PWI snapshot may not accurately reflect temporal change and may be an inaccurate predictor. In addition, follow-up neuroimaging was not available in most patients, and therefore we were not able to consider the effect of spontaneous recanalization on clinical outcomes.
Conclusions
In conclusion, our study showed that END was frequent in patients with minor stroke and acute LVO and could be predicted using perfusion/diffusion imaging variables. Tmax >6 seconds ≥53.73 mL, Tmax >6 seconds – DWI ≥32.77 mL, and Tmax 4–6 seconds ≥55.20 mL were independently associated with END and unfavorable functional outcomes at 3 months. These thresholds could be considered as reference values to select candidates for immediate EVT in minor stroke patients at a high risk of END to improve outcomes.
Supplementary materials
Supplementary materials related to this article can be found online at https://doi.org/10.5853/jos.2020.01466.
Patients’ characteristics by IV tPA status
Baseline demographics of enrolled patients and patients who underwent EVT before END
Imaging variables of enrolled patients and patients who underwent EVT before END
Flowchart of patient screening and enrollment. NIHSS, National Institutes of Health Stroke Scale; mRS, modified Rankin Scale; LVO, large vessel occlusion; IC-ICA, intracranial internal carotid artery; MCA, middle cerebral artery; EVT, endovascular treatment; END, early neurological deterioration; PWI, perfusion-weighted imaging.
Notes
Disclosure
The authors have no financial conflicts of interest.