


Introduction
Intracerebral hemorrhage (ICH) carries a high mortality rate and burden of morbidity [1]. Most predictors of outcome in ICH, such as age, Glasgow Coma Scale (GCS) score, initial hematoma volume and hematoma location, are unmodifiable [2,3]. In contrast, significant hematoma expansion (HE), which occurs in up to a third of patients with ICH, is a strong and potentially modifiable predictor of poor functional outcome and mortality [4,5].
The spot sign (SS), defined as one or more spots of enhancement within an acute hematoma due to active contrast extravasation on computed tomography angiography (CTA), has been shown to predict HE as well as clinical outcome [6]. However, varying CTA acquisition techniques, such as arterial phase or delayed (venous) phase imaging, result in a wide range of diagnostic accuracy. Two meta-analysis showed a rather low pooled sensitivity of 57% and 62% of the SS for predicting HE [2,7].
Assessment of SS on CTA might be challenging as it is difficult to differentiate hyperdense hemorrhage from contrast agent. Dual-energy CTA (DE-CTA) is a technique that uses high- and low-peak voltage acquisitions simultaneously [8,9]. Because of the difference in energy-dependent attenuation curves, DE-CTA can distinguish between hemorrhage and iodinated contrast media [10]. We hypothesized that the application of DE-CTA, including both arterial and delayed phase imaging, improves the diagnostic accuracy of the SS for predicting HE in patients with primary ICH when compared to conventional-like arterial and delayed phase imaging.
Methods
Patient selection and image acquisition
We prospectively included patients (aged 18 years or older) with imaging confirmed primary ICH admitted to the Maastricht University Medical Center (MUMC), the Netherlands, between January 1st, 2014 and December 31st, 2019. The study was approved by the medical ethical committee of the MUMC. Written informed consent for collection and analysis of clinical data was obtained if possible, but the requirement for consent was waived in case a patient died before consent or when the patient was incapacitated by the stroke and no legal representative was available.
Patients with traumatic ICH, secondary ICH including vascular malformations, hemorrhagic transformation of ischemic stroke and neoplasms as well as non-parenchymal hemorrhage (e.g., epidural, subdural, subarachnoid, and primary intraventricular hemorrhage [IVH]) were not included. We excluded patients who did not undergo DE-CTA and/or follow-up computed tomography (CT) within 48 hours. Patients were excluded if the delay between baseline brain CT and DE-CTA was >3 hours. Patients who underwent surgical evacuation of the hematoma before follow-up CT were also excluded from analysis. Patients lacking follow-up CT, but otherwise fulfilling inclusion criteria, were included in the secondary analysis of functional outcome.
Patient characteristics
Clinical data including age, sex, time of last seen well (LSW), GCS at admission, anticoagulant use, systolic blood pressure at admission, glucose at admission, and cardiovascular risk factors were collected. Functional outcome was assessed at 3 months on the modified Rankin Scale (mRS) and was obtained either through standardized interviews or outpatient clinical contact. Poor outcome was defined as mRS ≥3.
Image acquisition and post-processing
As part of standard care in patients with ICH, non-contrast brain CT was followed by DE-CTA at arterial phase as well as an 80-second delayed phase. Non-contrast and DE-CTA imaging was obtained using a second-generation dual-source CT system (Somatom Definition Flash or Somatom Definition Force, Siemens Healthcare, Forcheim, Germany). Non-contrast CT (both primary CT as well as follow-up CT) were acquired from skull base to the cranial vertex with the following parameters: 120 peak kilovoltage (kVp), 340 reference milliampereseconds (ref. mAs), slice thickness/spacing 1.0 mm, computed tomography dose index (CTDI) 34 mGy. Patients then received 90 mL intravenous contrast media (Ultravist 300 mg/mL, Bayer Healthcare, Leverkusen, Germany) with a flow of 5 mL/sec. The hereafter performed dedicated dual-source protocol comprised of arterial phase imaging (80/140 kVp, 135/68 ref. mAs, CTDI 7.86 mGy) and 80-second delayed phase imaging (80/140 kVp, 550/275 ref. mAs, CTDI 25.34 mGy) with rotation time set at 0.28 seconds and 2×64×0.6 mm collamination.
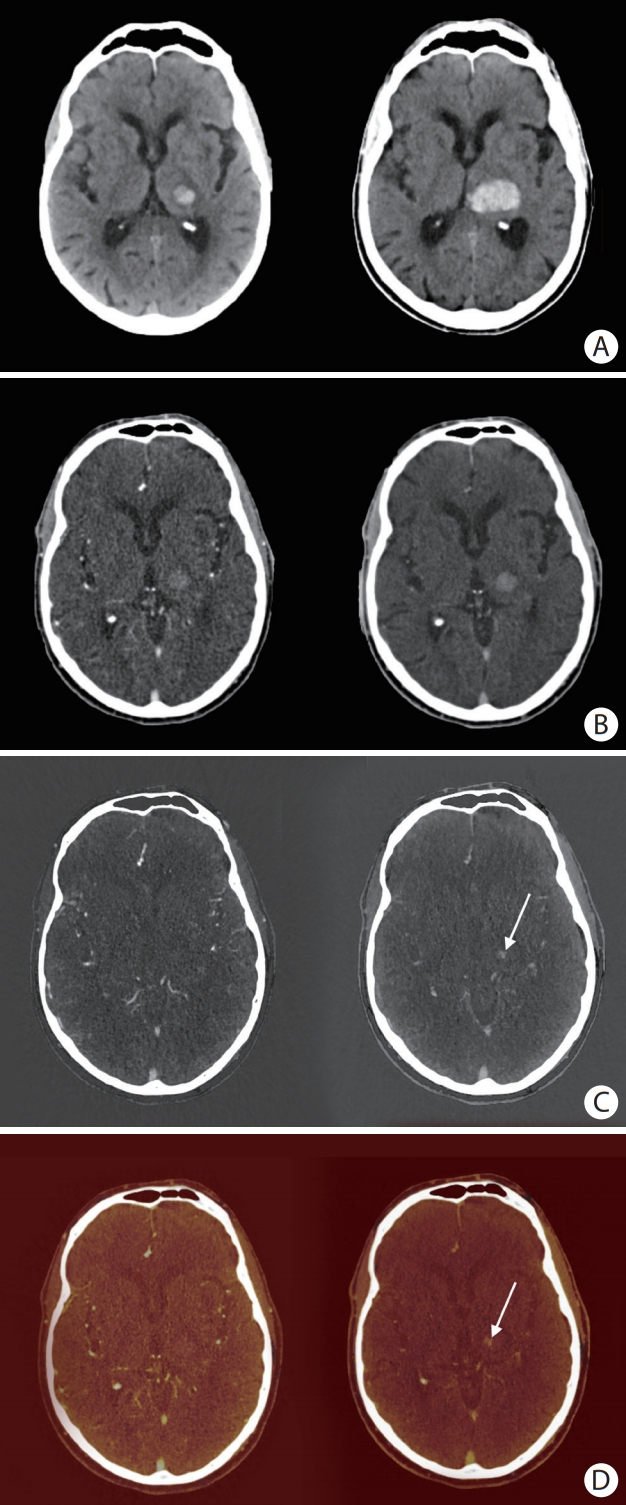
Conventional-like mixed images, which simulate single-energy acquisitions at a typical kVp of 120, were generated by blending data from the high—and low energy component with a weighted average of 0.6 [11]. These conventional-like mixed images were generated for both the arterial phase (mixed arterial) and delayed phase (mixed delayed). Post-processing took place using SyngoVia (Siemens Healthcare) to generate iodine maps (arterial iodine and delayed iodine) using three-material decomposition [8,12,13]. Fusion images were created by registration and overlaying of the iodine with the mixed images (arterial fusion and delayed fusion). Examples of the different imaging datasets are presented in Figure 1. Non-enhanced follow-up brain CT was performed within 48 hours after the primary brain CT.
Imaging analysis
All DE-CTA datasets were analyzed by an experienced neuroradiologist (A.A.P.) with >10 years of experience, who was blinded to clinical data and HE status. Per protocol consecutively the non-enhanced brain CT, mixed arterial phase, mixed delayed phase, arterial phase iodine, arterial phase fusion, delayed phase iodine, and delayed phase fusion images were assessed (Figure 1). SS was defined as ≥1 foci of contrast within the hematoma and discontinuous from surrounding blood vessels. Hematoma location was classified as supratentorial or infratentorial. The interobserver agreement for identifying the SS was calculated with the Cohen’s kappa coefficient (κ). After assessment of 30 randomly picked cases by two neuroradiologists (A.A.P., W.J.P.H.) the interobserver agreement was lowest, but still substantial for mixed arterial and mixed delayed phase imaging (both κ of 0.62), which is comparable to a previous study [14]. The interobserver agreement improved on the DE datasets, reaching near perfect on arterial phase iodine and delayed phase fusion datasets (κ of 0.77 and 0.84, respectively).
Baseline and follow-up ICH volumes were measured using a semi-automated volume segmentation technique in SyngoVia (Siemens Healthcare). When semi-automated volume determination was not possible (e.g., due to technical issues, n=33), ICH volumes were calculated using the validated ABC/2 method.15 IVH was excluded from volume measurements. Significant HE was defined as a volume increase of >6 mL or an increase of >33% from baseline ICH volume [5,6].
Statistical analysis
Statistical analysis was performed using SPSS for Windows version 25.0 (IBM Corp., Amonk, NY, USA). To test for differences between groups we used chi-square test for categorical data and Mann-Whitney test for non-normally distributed data.
Sensitivity, specificity, positive predictive value, negative predictive value (NPV), and accuracy of the SS for HE were calculated for the different DE-CTA datasets separately as well as for presence of the SS on any of these DE-CTA datasets. Receiver operating characteristic (ROC) curves were computed and area under the curve (AUC) was calculated. A value of P≤0.05 was considered significant.
Univariable logistic regression analyses was used to test for associations between HE (dependent variable) and demographic, clinical and radiological variables, process measures and SS on DE-CTA dataset that showed highest accuracy. Age, sex, SS, and those variables associated with HE in univariable regression analysis at a P<0.10 level, were subsequently analyzed in multivariable logistic regression analysis.
Both univariable and multivariable logistic regression analyses were performed to test for associations between poor outcome (dependent variable) and age, sex, SS on DE-CTA dataset that showed highest accuracy and other well-known predictors of outcome (anticoagulant use, systolic blood pressure at admission, glucose at admission, GCS, baseline ICH volume, presence of IVH on first CT-scan, and infratentorial ICH location).
Results
Study population
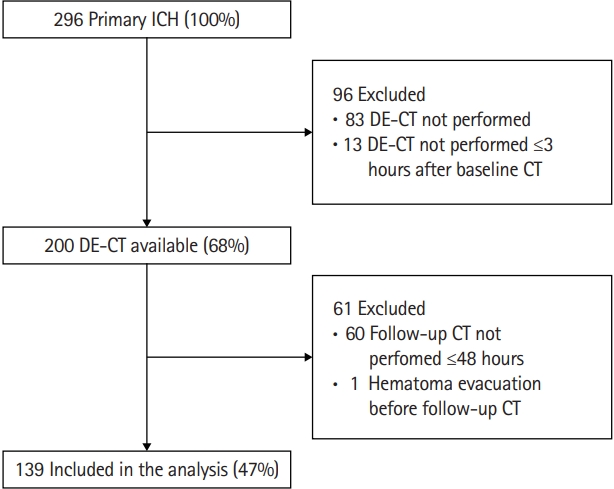
A total of 296 primary ICH patients presented to our emergency department between 2014 and 2019. Ninety-six patients were excluded, either because no DE-CTA was performed (n=83) or DE-CTA was performed ≥3 hours after baseline CT (n=13) (Figure 2). These excluded patients (n=96) more often were female, were older, had a higher serum glucose on admission, showed a larger baseline hematoma volume with more frequent intraventricular expansion, presented with lower GCS, and more frequently had poor outcome, when compared to patients who were included (Supplementary Table 1). Most frequently reported reason for not performing DE-CTA were very poor prognosis on presentation or a diminished renal function.
We further excluded 60 patients because they did not receive follow-up CT ≤48 hours (due to poor clinical status or demise), and one patient who underwent hematoma evacuation before follow-up CT was performed (Figure 1). We included 139 patients for analyses. Baseline characteristics of included patients are presented in Table 1.
Spot sign and hematoma expansion
A total of 47 patients showed HE (33.8%). Patients with HE more often used anticoagulants and had shorter window from LSW to DE-CTA. Furthermore, patients with HE had a poorer functional outcome at 3 months.
Presence of SS on the different DE-CTA datasets is presented in Table 1. Not all DE-CTA datasets could be constructed in all patients. SS was more often detected on delayed phase imaging compared to first pass imaging, in all datasets (mixed, iodine, fusion). HE was significantly more frequent in all SS positive patients compared to SS negative patients.
Table 2 presents performance of SS on different DE-CTA datasets for predicting HE. Sensitivity of SS for HE increased from 31.9% on mixed arterial phase imaging to 76.2% on delayed phase fusion imaging. Accuracy was highest for delayed phase fusion imaging (0.80; 95% confidence interval [CI], 0.70 to 0.88; P<0.001).
Table 3 presents the associations between HE (dependent variable) and age, sex, cardiovascular risk factors, anticoagulant use, systolic blood pressure at admission, GCS, baseline ICH volume, time from LSW to DE-CTA imaging, and SS on delayed phase fusion imaging. In univariable regression analysis the SS on delayed phase fusion was associated with HE (odds ratio [OR], 15.08; 95% CI, 6.04 to 37.66), as were anticoagulant use, shorter time from LSW to imaging (DE-CTA) and larger baseline ICH volume. In multivariable regression analysis, the SS on delayed phase fusion imaging was independently associated with HE (OR, 17.5; 95% CI, 6.14 to 49.82).
Spot sign and poor outcome
To assess the association between SS and poor outcome, we reincluded patients fulfilling the inclusion criteria of this study but lacking follow-up CT ≤48 hours after baseline CT (n=60) and one patient who underwent hematoma evacuation before follow-up CT. Clinical outcome after 3 months was available in 179 patients. A total of 133 patients (66.5%) had poor outcome after 3 months (mRS ≥3). Both univariable and multivariable logistic regression analyses showed an independent association between poor outcome and presence of SS on delayed phase fusion imaging. These findings are summarized in Table 4.
Discussion
In this study we found that the application of DE-CTA, and more specifically the evaluation of delayed phase fusion images, improves the diagnostic accuracy of the SS for HE when compared to conventional-like mixed arterial and mixed delayed phase imaging. We demonstrated a sensitivity of 32% of the SS on mixed arterial phase, which increased to 76% for a SS on delayed phase fusion. In addition, we showed that the presence of SS on delayed phase fusion is independently associated with poor clinical outcome.
Studies on the application of DE-CT in the detection of SS in ICH are sparse. A retrospective small study in 36 patients with primary and traumatic ICHs, showed that DE-CT facilitates SS detection and is able to differentiate iodine contrast from hematoma when compared to a delayed phase enhanced CT (2 minutes after contrast injection). HE was not analyzed [9]. Another study used a machine learning approach on DE-CT acquisitions in primary ICH and identified two quantitative markers of HE, which were combined in a HE probability score. The HE probability score showed better accuracy for prediction of HE compared to the conventional SS as assessed on single-energy CT [9,16]. Although this study used an automatic iodine quantification method, while we visually assessed SS, its rationale to use DE-CT for improved detection of SS in predicting HE is likewise.
The independent association between SS and HE has been shown in various other studies. Reported sensitivity of the SS for predicting HE ranges from 21% to 93%, with two recent meta-analyses showing a pooled sensitivity of 62% and 57% respectively [2,4,7,17-25]. We found a low sensitivity of 32% of the SS on conventional-like mixed arterial phase imaging for predicting HE. While we set no limitation in the onset or LSW-to-scan time in order to not exclude late expanders, many former studies only included patients with an onset-to-scan time ≤6 hours. A former study found a 60% sensitivity of SS for HE if CTA took place within 2 hours of onset, declining to 30% in patients with onset-to-scan time >8 hours. The sensitivity of SS for HE therefore seems to be inversely related to onset-to-scan time [26]. Furthermore, varying definitions of HE as well as the difficulty of differentiating hyperdense hemorrhage from contrast media extravasation could contribute to the differences in sensitivity. In the most used definition of SS (an attenuation ≥120 Hounsfield units), the differentiation of SS from surrounding ICH (having attenuation of 30 to 90 Hounsfield units) can often be reliably established on single-energy CTA. However, subtle contrast extravasation is more difficult to differentiate from surrounding ICH on single-energy CTA, but nevertheless is clinically important. A previous study found that a >10% increase in Hounsfield units within an ICH between arterial phase and delayed phase (defined as a ‘leakage sign’) is even more sensitive for predicting HE and poor outcome compared to SS [22]. Another important factor influencing SS sensitivity for HE is the contrast phase timing of scanning. The landmark prediction of haematoma growth and outcome in patients with intracerebral haemorrhage using the CT-angiography spot sign (PREDICT) study reported a sensitivity of 51% of the SS on CTA for HE; however, approximately 20% of CTAs were actually made in the venous phase [27]. It has been shown that sensitivity of SS for predicting HE improves when adding a delayed CTA [21]. In our study we performed bolus-timed injection of contrast media for acquiring the arterial images.
Delayed phase post-contrast CT acquisition have been shown to not only increase SS detection, but also improve the sensitivity of SS for predicting HE as well as outcome [21,27-29]. Our results are in accordance to these findings with conventionallike mixed delayed phase images more often showing SS as well as having a higher sensitivity for HE when compared to conventional-like mixed arterial phase images. An additional increase in sensitivity, NPV, and accuracy of the SS for HE is seen when DE-CT iodine and fusion datasets are also assessed.
We performed delayed phase imaging at 80 seconds as compromise between persistent venous enhancement and parenchymal enhancement. Other studies reporting on delayed phase, second-pass or multiphase imaging in relation to SS, HE and outcome show a wide distribution in the timing of delayed phase imaging, ranging between 4 and 120 seconds after bolus-timed CTA [21,22,29,30]. The optimal timing of delayed phase imaging is unknown. There have been concerns of higher radiation dose of DE-CT compared to single-energy CT, but advances in technology have lowered the radiation dose of DE-CT to comparable, or even lower values when compared to single-energy CT [12,31]. Therefore, a DE-CT protocol as used in this study, can be safely used in daily clinical practice.
One of the limitations of our study is the high rate of lacking DE-CTA and follow-up CT, mostly due to poor clinical status or demise. This could cause selection bias, and possibly underestimate the amount of hematoma-expanders. This is, however, a reflection of clinical practice and comparable to other studies [21,32]. Furthermore, SS and HE probably have little extra value in these cases. Lastly, we had irretrievable loss of some of DE-CTA source data during the course of the study, especially of the delayed fusion images which are missing in 17 patients.
In an attempt to stop or decrease HE, the SS has become a selection tool for therapeutic interventions. Several trials are ongoing, for example the Dutch Intracerebral Hemorrhage Surgery Trial (DIST), Swiss trial of decompressive craniectomy versus best medical treatment of spontaneous supratentorial intracerebral hemorrhage (SWITCH) trial, and Interleukin-1 Receptor Antagonist in Intracerebral Hemorrhage (BLOC-ICH). Applying DE-CTA for the detection of SS in primary ICH patients will gain more and more clinical value and could help to select eligible patients for (future) treatment trials.
Conclusions
We found that delayed phase fusion imaging has the best diagnostic performance of the SS to predict significant HE, when compared to conventional-like mixed arterial phase imaging, and is associated with poor clinical outcome. Performing DE-CTA in acute ICH patients, including delayed phase fusion imaging, may help to identify eligible patients for (future) treatment trials (e.g., hemostatic therapy or surgical interventions).