The Challenge of Designing Stroke Trials That Change Practice: MCID vs. Sample Size and Pragmatism
Article information

Abstract
Randomized controlled trials (RCT) are the basis for evidence-based acute stroke care. For an RCT to change practice, its results have to be statistically significant and clinically meaningful. While methods to assess statistical significance are standardized and widely agreed upon, there is no clear consensus on how to assess clinical significance. Researchers often refer to the minimal clinically important difference (MCID) when describing the smallest change in outcomes that is considered meaningful to patients and leads to a change in patient management. It is widely accepted that a treatment should only be adopted when its effect on outcome is equal to or larger than the MCID. There are however situations in which it is reasonable to decide against adopting a treatment, even when its beneficial effect matches or exceeds the MCID, for example when it is resource-intensive and associated with high costs. Furthermore, while the MCID represents an important concept in this regard, defining it for an individual trial is difficult as it is highly context specific. In the following, we use hypothetical stroke trial examples to review the challenges related to MCID, sample size and pragmatic considerations that researchers face in acute stroke trials, and propose a framework for designing meaningful stroke trials that have the potential to change clinical practice.
Interpreting randomized trial results in different dimensions
Randomized controlled trials (RCTs) are the cornerstone of evidence-based medicine. Changing treatment guidelines and obtaining approval from regulatory bodies to establish a new treatment as a standard of care generally requires high-level evidence from at least one well-designed RCT. For example, both intravenous alteplase and endovascular treatment (EVT) were adopted as standard treatment in acute ischemic stroke, only after their safety and efficacy was proven in several RCTs [1-6]. When designing and interpreting RCTs, physicians have to consider several dimensions, for example the statistical dimension (are the results statistically significant? Is the observed effect due to chance or real?) and the clinical dimension (is the result meaningful to patients and relevant to physicians’ management decisions?). While there is a clear, accepted definition for the former (learning how to assess statistical significance of a study is an integral part of every medical school curriculum), there is still no consensus on how to determine the clinical relevance of trial results. In fact, some clinicianscientists have become so pre-occupied with measures of statistical significance—P-values in particular—that the question of clinical meaningfulness appears to have become secondary or, worse, is not addressed at all. Researchers often use the term “minimal clinically important difference” (MCID) or “target difference[7]," to describe the smallest change in outcomes a treatment has to achieve to be considered meaningful by a patient and lead to a change in patient management. The MCID was originally defined by Jaeschke et al. as “the smallest difference in score in the domain of interest which patients perceive as beneficial and which would mandate, in the absence of troublesome side effects and excessive cost, a change in the patient’s management[8]." This original definition includes another dimension, the “economic dimension.” However, the way in which MCID is currently used does not account for treatment costs [9].
Factors influencing the minimal clinically important difference
While a P<0.05 indicates statistical significance except for rare instances in which one-sided testing is performed or adjustments for multiple comparisons are made, there is no such universal threshold for the MCID. The MCID is highly context-specific and depends on several factors, including (1) the disease, (2) the treatment (and its associated risks), (3) the outcome, and (4) the patient (Table 1). Lastly, yet importantly, the MCID is also dependent on the physician and whether he or she judges a certain difference in outcome sufficient to alter the patient’s treatment regimen.

Factors influencing the MCID in acute ischemic stroke
Beyond the MCID: additional factors to consider when interpreting the results of randomized trials
It is widely accepted that in the setting of a superiority trial, a treatment should only be adopted when its effect on outcome is equal to or larger than the MCID. There are however situations in which it is reasonable to decide against adopting a treatment, even when its beneficial effect matches or exceeds the MCID; for example, when it is resource-intensive and associated with high costs. While it would be desirable from a patient perspective to adopt any treatment with an effect on outcome that is equal to or larger than the MCID, this is not always possible from a societal perspective: when resources are scarce, adopting another, less expensive and resource-intensive treatment may lead to larger improvements in outcome on a population (albeit not at an individual) level, because one can afford to treat more patients overall. This additional “economic” dimension of the treatment under investigation is not discussed in many RCTs, partly because most randomized trials are conducted in high income countries [10]. As such, they often investigate costly treatments that require advanced infrastructure and high-yield equipment, so that their results are irrelevant to large parts of the world that lack the necessary infrastructure, equipment and expertise to disseminate a novel but expensive therapy.
Challenges when applying the MCID to acute stroke trials
In an ideal world, a randomized trial should only be conducted if the effect size of the treatment is thought to equal or exceed the MCID. This implies that trials should ideally be sufficiently powered to detect an effect size that equals the MCID. As the MCID gets smaller (i.e., effect size the trial needs to be powered for), the required sample size increases non-linearly (Figure 1) [11]. Unfortunately, despite clear recommendations (e.g., from the CONsolidated Standards of Reporting Trials [CONSORT] and Difference ELicitation in TriAls 2 [DELTA2] statements [7,12]), it is still rare for trialists to explain how they have arrived at their MCID estimate and typically the sample size of an RCT is influenced by many other factors [13]. There are many reasons why researchers are reluctant to use (or report) the MCID: perhaps the most important one may be that it is a rather vague concept without any clear guidelines on how it should be defined. Furthermore, in clinical reality, the sample size of a trial is often dictated by practical and financial restraints (number of sites, prevalence/incidence of the disease, limited funding, etc.) rather than considering the MCID. In some cases, researchers may even “work backwards” and define the estimated treatment effect and MCID after they have calculated the maximum sample size that is practically feasible, putting themselves at risk of making biased and over-optimistic assumptions regarding the treatment effect size. For the same practical limitations mentioned above, researchers may also choose surrogate outcomes (e.g., reperfusion quality as measured by the expanded Thrombolysis in Cerebral Infarction Score [eTICI] as a surrogate for clinical outcome in EVT trials) or composite outcomes (e.g., recurrent stroke, myocardial infarction, or vascular death as a composite outcome in cardiovascular prevention trials). Importantly, it should be noted that these practices are rarely used to deliberately manipulate trial results. Most often, they merely reflect researchers’ reactions to the obstacles they encounter and are necessary to ensure feasibility of the trial. Unfortunately, this often leads to trial results that are challenging to interpret at best, and non-informative or misleading at worst, therefore being of little or no practical value to the medical community [14]. This is illustrated by the following four purely hypothetical examples.

Relationship between effect size, power, and sample size. Sample size increases with decreasing effect size. Higher power (power=the probability that the trial will detect a significant difference if this difference truly exists) also requires higher sample sizes.
Example 1
Randomized trial (superiority design) testing an adjunctive cooling device that induces hypothermia in addition to EVT vs. EVT alone. The primary outcome is good clinical outcome, defined as 90-day modified Rankin Scale (mRS) score 0 to 2. An independent expert panel, which was asked to determine the MCID prior to the trial, achieved consensus on an MCID of an absolute 5% difference between the two treatment groups. The presumed mRS 0 to 2 rate in the control arm is 53%. Thus, a 58% mRS 0 to 2 rate would be required in the intervention arm. Detecting the MCID would require a sample size of 1,773. Because of financial limitations and underestimation of dropouts, the final sample size is 1,230; the trial is powered to detect an 8.5% difference in the primary outcome. The final result shows an increase in good outcome in the treatment arm of 6%, which is non-significant.
Problem
This is a common scenario, in which the trial is underpowered and therefore even though the final difference in outcome may be numerically higher than the MCID, it is not statistically significant. This results in a missed opportunity of therapy with (possible) clinically meaningful effect that may not make it to practice due to inadequate sample size.
Potential solutions
The most obvious solution would be to increase the sample size, but this is often not possible for practical reasons. Another option is to combine patient-level data from several RCTs into a meta-analysis (e.g., the Highly Effective Reperfusion evaluated in Multiple Endovascular Stroke [HERMES] Trials collaboration [4], which combined the seven major EVT trials for large vessel occlusion stroke and provided additional important information about subgroups). This is also helpful as it allows assessment of treatment effect modification by certain variables and outcomes in different patient subgroups that may have been underrepresented in the individual trials. One caveat of this approach is that the trials need to be relatively homogenous in their design and selection criteria in order to combine them into a single meta-analysis. Cooperation among trial organizers to prespecify such a meta-analysis is also valuable.
Example 2
Randomized trial (non-inferiority design) testing a novel thrombolytic agent versus an established thrombolytic agent in acute ischemic stroke. The primary outcome is good clinical outcome, defined as mRS 0 to 2 at 90 days. In preparation of another randomized trial with a superiority design that investigated a similar question, an independent expert panel was asked to define the MCID and achieved consensus on an MCID of 10%. The proportion of good outcomes with the established drug (control arm) is 55% based on previous observational data. Applying a 10% MCID to the current non-inferiority trial results in a non-inferiority margin of 45% and a sample size of 360 patients. The trial is adequately powered and shows non-inferiority of the novel drug, with an overall difference in outcomes of 7% (good outcome achieved by 55% [95% confidence interval (CI), 52.4 to 57.7] in the control arm [established drug] and by 48% [95% CI, 45.5 to 50.5] in the treatment arm [novel drug]), i.e., the CI of the proportion in the treatment arm does not include the non-inferiority margin (the lower boundary of the CI is 45.5%, which is above the non-inferiority margin of 45%) (Figure 2).
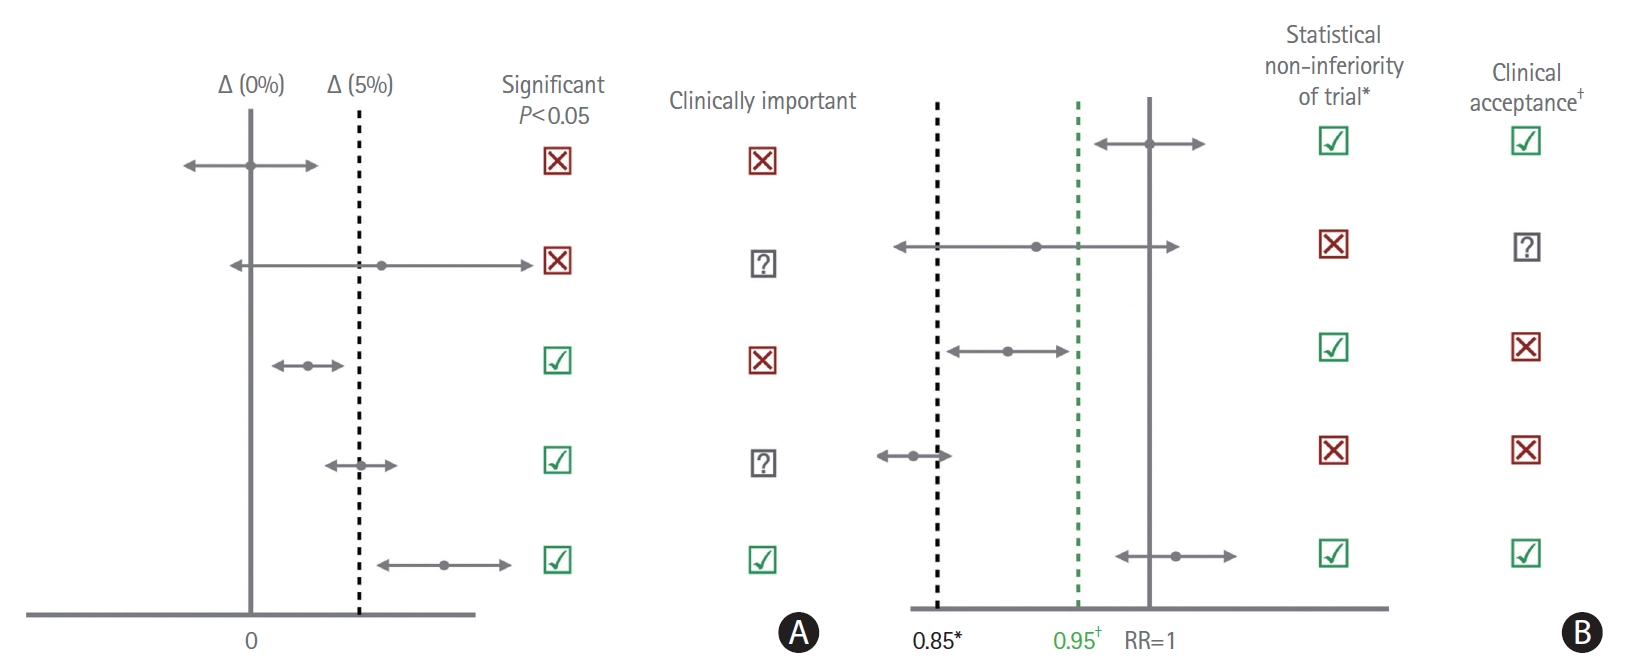
(A) Different trial result scenarios for a superiority design, using a minimal clinically important difference (MCID) of 5% as an example, showing how the observed result may be clinically meaningful, statistically significant, neither, or both. The solid vertical line represents a difference in outcomes of 0%, indicating no treatment effect. Upper row: The difference in outcomes between treatment and control arm is exactly 0, and the CI does not include the MCID. Thus, the difference is not statistically significant and shows no clinically relevant effect. Second row: The difference is approximately 6% in favor of the new treatment and the CI crosses both 0% and 5% (i.e. contains the null-effect line and the MCID). Thus, the result is not statistically significant. Whether the treatment leads to a clinically relevant difference cannot be determined since there is a chance that the treatment effect is larger than the MCID (since parts of the CI are to the right of the dashed line). Third row: The difference in outcome is approximately 3% in favor of the new treatment and the CI neither contains the MCID nor 0% (the null-effect line). Thus, the difference is statistically significant but not clinically relevant. Fourth row: The difference between the two arms is 5% in favor of the new treatment and the CI contains the MCID (vertical dashed line) but not 0% (the vertical line). Thus, the difference is statistically significant but just reaching clinical relevance, whether it is truly clinically relevant cannot be inferred from this result since parts of the confidence interval are to the left of the dashed line. Other factors such as cost will influence adoption. Lowest row: The difference between the two arms is approximately 8% and the CI neither contains the MCID nor 0% (the CI is entirely right to the MCID). Thus, the difference is statistically significant and clinically relevant. (B) Different trial result scenarios for a non-inferiority trial design, a risk ratio (RR) of 1 (vertical solid line) indicates no difference between the two treatments, and the RR should be >0.95 (between 0.95 and 1) in order for the new treatment to be clinically accepted as a valid alternative to the established treatment. Upper row: The point estimate for the RR is 1 (indicating no effect) and the CI boundary neither includes the MCID nor the non-inferiority margin (the CI is located to the right of the MCID and non-inferiority margin), indicating statistical non-inferiority and clinical acceptance of the new treatment. Second row: The point estimate for the RR is 0.90, and the CI includes the non-inferiority margin, and the MCID. Thus, statistical non-inferiority is not proven and it is unclear whether the new treatment could be a clinically acceptable alternative to the established treatment. Third row: The point estimate for the RR is 0.88 and the CI is entirely to the right of the statistical non-inferiority margin (as chosen by the investigators) and entirely to the left of the MCID. Thus, statistical non-inferiority is proven; however, the new treatment does not constitute a clinically acceptable alternative, since the difference between the treatments favors the established treatment and is larger than the MCID. Fourth row: the point estimate for the RR is 0.84 and the CI contains the statistical non-inferiority margin and is located entirely to the left of the MCID. Thus, statistical non-inferiority is not proven and the new treatment does not constitute a clinically acceptable alternative, since the difference between the treatments favors the established treatment and is larger than the MCID. Lowest row: The point estimate for the RR is 1.1 and the CI is located entirely to the right of the statistical non-inferiority margin and the MCID: Thus, statistical non-inferiority is proven and the new treatment constitutes a clinically acceptable alternative to the established treatment. The non-inferiority margin chosen by *the trialists (RR, 0.85) differs from †the MCID (RR, 0.95).
Problem
The MCID that was applied in this trial with non-inferiority design was actually defined in the setting of a superiority trial. When using a superiority trial design, choosing a large MCID results in a more conservative assessment, i.e., the treatment will have to have a larger effect in order to be considered clinically meaningful and get adopted. In a non-inferiority setting, choosing a large MCID will result in low non-inferiority margins, which means that the alternative treatment can be substantially worse and still be considered “non-inferior” to the standard treatment. In other words, one can always make an alternative treatment non-inferior if one chooses a large enough MCID. Although the study was adequately powered, physicians may perceive the non-inferiority margin too large to change their treatment decisions based on the results. This raises the question whether the MCID should be specific to the RCT design. A common approach for non-inferiority trials is to employ an MCID that is 50% of that was used for a previous superiority trial exploring a similar topic. 15 This however has its own pitfalls; the superiority trial, for example, could be “outdated,” its results no longer reflecting the current knowledge base.
Potential solutions
Perhaps the best solution would be to set up an independent committee that decides upon MCIDs for key outcome measures, independent of the trial investigators. The Stroke Therapy Academic Industry Roundtable has published a consensus paper on what would constitute an appropriate MCID for certain acute stroke therapies that apply to specific outcome measures [16]. A similar approach could be taken to define a catalogue of MCIDs that are specific to the condition (e.g., secondary prevention trials vs. acute stroke trials), treatment under investigation (pharmacological vs. interventional), outcome measure, and trial design. Of course, due to the dependence of the MCID on various factors (Table 1), individual trials may still require slight modifications.
Example 3
Randomized trial (superiority design) testing the efficacy and safety of an aggressive ultralow blood pressure regimen against a regimen targeting normal blood pressure in the first 72-hour post intravenous thrombolysis. The primary outcome is a composite outcome, consisting of the following three components: (1) symptomatic intracranial hemorrhage; (2) any intracranial hemorrhage leading to a prolonged stay on the intensive care unit; (3) any intracranial hemorrhage requiring repeated imaging evaluation. An independent expert consensus panel was asked to define the MCID and determined it to be 7%. The primary outcome rate is assumed to be 12% in the control arm, i.e., a 5% outcome rate would be required in the intervention arm. This results in a sample size of 568 patients. The trial is adequately powered and the results show a significant reduction in the primary outcome with the ultralow blood pressure regimen (13% in the ultralow blood pressure arm vs. 21% with standard management). This was mainly driven by a reduction in patients with any intracranial hemorrhage that required repeated imaging evaluation.
Problem
Composite outcomes are often used to increase the number of end points, particularly when those end points are rare (e.g., recurrent stroke, death), to reduce sample size requirements. One commonly encountered problem is that the less severe and/or less relevant components occur more commonly and therefore drive the treatment effect. This was also the case in the hypothetical example, in which the beneficial effect of ultralow blood pressure management was mainly driven by a reduction in any intracranial hemorrhage that requires repeated imaging evaluation, which is a rather vague and subjective endpoint that depends on local policies, access to imaging and individual physicians’ practice patterns.
Potential solutions
When composite endpoints are used, they should be chosen in such a way that they reflect the same underlying condition or pathophysiological process. “Recurrent ischemic stroke” and “recurrent transient ischemic attack,” for example can be reasonably composed into an outcome, since they reflect different aspects of ischemic brain disease, while “recurrent ischemic stroke” and “recurrent hemorrhagic stroke” may be the result of two completely different underlying pathophysiological processes and should therefore not be combined into a composite outcome. In order to allow for unbiased, comprehensive assessment of RCT results with composite outcomes, investigators should explain the biological reasoning behind the composite outcome. Furthermore, they should present the results of the individual components separately in addition to the composite outcome. Even if the treatment effect in one or more components does not reach statistical significance, the direction of effect should be the same, and there should be no evidence of harm. Routine reporting of individual component analysis in composite outcome RCTs could be easily implemented at the level of funding agencies and journal policies. Additionally, one could potentially apply a weighting factor to the different components according to their clinical relevance [17]. If one would attempt such a “weighted composite outcome,” it should however be mandatory to pre-define these weights in the statistical analysis plan prior to unblinding, in order to avoid a biased choice of the weighting factors.
Example 4
Randomized trial (superiority design) testing the safety and efficacy of a new EVT device compared to “standard” EVT with stent-retriever, distal access catheter and balloon guide catheter. The primary outcome is near-complete reperfusion, defined as an eTICI of 2c or 3. An independent expert panel was asked prior to the study to define the MCID and achieved consensus on an MCID of 10%. This results in a sample size of 886 patients. The eTICI 2c/3 rate in the control arm is estimated to be 50%, i.e., a 60% eTICI 2c/3 rate would be required in the intervention arm. The trial is adequately powered and the treatment arm in which the new device was used achieved a significantly higher eTICI rate (67% eTICI 2c/3 vs. 55% in the control arm, i.e., a 12% absolute difference). There was however no meaningful improvement in clinical outcome (mRS 0–2 at 90 days), which was a pre-specified secondary endpoint (55% mRS 0–2 in the treatment arm vs. 54% in the control arm).
Problem
While an improvement in clinical outcome certainly provides the most robust evidence for a treatment, choosing a clinical outcome as primary outcome in RCTs is not always possible. The MCID does not necessarily have to express a difference in clinical outcomes, because surrogate outcomes can lead to a change in patient management as well. Such surrogate outcomes are commonly used in RCTs because they are less expensive to obtain than clinical outcomes and avoid the need for a long follow-up period, thereby reducing drop-outs. That being said, surrogate outcomes should be closely correlated with clinical outcome, genuinely predict the treatment’s impact on the outcome the treatment is truly targeted at, and chosen in such a way that they could influence patient management. This also implies that parameters that do not usually show the same direction of effect as the true target outcome must not be used as surrogate outcomes. While it is known that better reperfusion (higher eTICI grades) is associated with better clinical outcome, an improvement in clinical outcome could not be shown in this hypothetical example, which can easily occur due to confounding factors that occur after reperfusion, such as stroke unit care, access to post-stroke rehabilitation, etc. Of course, these confounding factors can go in either direction to increase or decrease the effect size.
Potential solutions
Similar to the different components in a composite outcome, one could argue that clinical outcomes, even if they are not the primary outcome, should be reported whenever available, and although there does not necessarily need to be a significant benefit (trials designed with a surrogate outcome are often underpowered to detect a clinical outcome measure), the direction of effect should be the same, and there should be no evidence of harm. One could argue that the MCID of surrogate outcomes should be significantly larger than the MCID that was defined for clinical outcome.
Future directions
Moving forward, we urge stroke trialists and the medical community as a whole to carefully consider not only the statistical significance of their study, but also whether the outcomes are clinically meaningful and how best to interpret and present them. While there is no one-size-fits-all solution to the MCID, there could be processes put in place that would help trialists plan and execute their studies [7]. For example, one could imagine a multidisciplinary committee that is in exchange and closely collaborating with guideline committees and can be approached prior to trial commencement to provide guidance on whether the results of a particular trial would be sufficient to change guidelines and therefore impact clinical practice. Investigators could present their proposal along with their suggested MCID to the committee, which could then invite additional experts (e.g., physicians from the field, guideline committee representatives, ethicists, healthcare policymakers) and patient representatives as deemed appropriate. Following expert assessment, the panel could then either approve the proposal, or give guidance to the researchers on how to revise their trial design (Figure 3). Another problem arises when randomized trials compare two treatment options (e.g., an EVT-alone approach without concurrent intravenous alteplase to EVT with concurrent intravenous alteplase), and some aspects of clinical care change. Imagine for example, intravenous tenecteplase becomes standard of care. In our current framework, the direct-to-EVT trials would theoretically have to be repeated using intravenous tenecteplase in place of intravenous alteplase. Such an approach is however time and resource consuming. Network meta-analyses, in which multiple treatments are compared by combining direct and indirect evidence from multiple RCTs, offer a potential solution to this problem (Figure 4), but they are still uncommon in stroke research. Furthermore, insufficient transitivity and network inconsistencies, i.e., a situation in which results from direct and indirect comparisons are in conflict with each other, are other issues that may arise when using this technique [18,19].
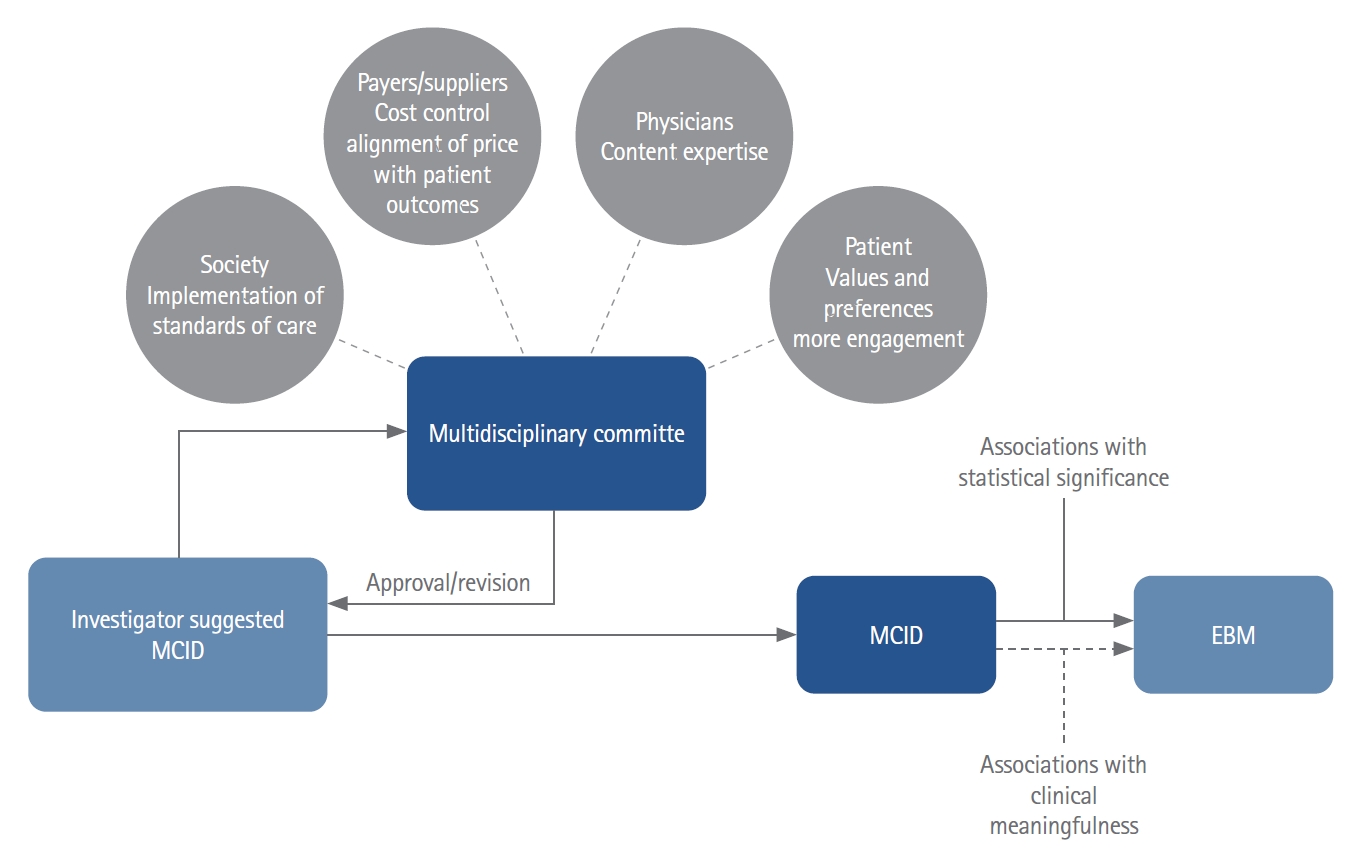
Hypothetical workflow for minimal clinically important difference (MCID) determination using a multidisciplinary committee that is collaborating and in close exchange with guideline committees. The trial investigators make their recommendation to the committee for approval prior commencement of the study. The committee could take input from additional experts such as physicians and healthcare policymakers, patient representatives, ethicists, etc. Following the assessment, the multidisciplinary committee would either approve the trial proposal if the conclusion is that the trial would likely change clinical practice in case of a positive result, or, if they think this is not the case, provide guidance on how to revise the trial proposal. EBM, evidence-based medicine.
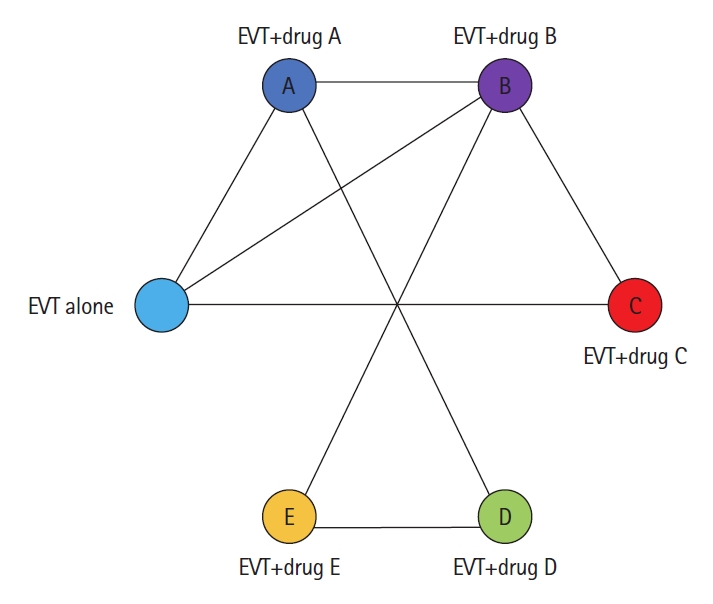
Network meta-analysis framework using the direct-to-endovascular treatment (EVT) question as an example. In theory, every thrombolytic agent (drugs A–E) would need to be directly compared to EVT alone. Such a direct comparison may not be available for all drugs. In this example, direct comparisons with EVT alone are only available for drugs A, B and C but not for drugs D and E. However, drug D has directly been compared to drug A and drug E to drug B. Network meta-analysis take all indirect and direct evidence into account and thereby allow us to compare drugs D and E with EVT alone despite the fact that there is no trial comparing them directly.
Conclusions
Randomized trials should be designed with the goal of producing clinically meaningful results. While the MCID represents an important concept in this regard, defining it for an individual trial is difficult as it is highly context specific. This could be addressed by an external multidisciplinary committee that closely collaborates with guideline committees. Furthermore, the stroke research community should strive towards a clear pathway to have trial data with an adequate sample size that is powered to detect the MCID. This could be done directly or through a planned meta-analysis of multiple similar trials. Conducting small trials that result in inconclusive results should be thought of as missed opportunities in which investigational treatments that may have a clinically meaningful effect never make it to clinical practice.
Notes
Disclosure
Mayank Goyal is a consultant (Medtronic, Stryker, Microvention, GE Healthcare, Mentice). Johanna Ospel is a consultant for GE Healthcare and NICOLab.