Trends in Venous Thromboembolism Readmission Rates after Ischemic Stroke and Intracerebral Hemorrhage
Article information

Abstract
Background and Purpose
Venous thromboembolism (VTE) is a life-threatening complication of stroke. We evaluated nationwide rates and risk factors for hospital readmissions with VTE after an intracerebral hemorrhage (ICH) or acute ischemic stroke (AIS) hospitalization.
Methods
Using the Healthcare Cost and Utilization Project (HCUP) Nationwide Readmission Database, we included patients with a principal discharge diagnosis of ICH or AIS from 2016 to 2019. Patients who had VTE diagnosis or history of VTE during the index admission were excluded. We performed Cox regression models to determine factors associated with VTE readmission, compared rates between AIS and ICH and developed post-stroke VTE risk score. We estimated VTE readmission rates per day over a 90-day time window post-discharge using linear splines.
Results
Of the total 1,459,865 patients with stroke, readmission with VTE as the principal diagnosis within 90 days occurred in 0.26% (3,407/1,330,584) AIS and 0.65% (843/129,281) ICH patients. The rate of VTE readmission decreased within first 4–6 weeks (P<0.001). In AIS, cancer, obesity, higher National Institutes of Health Stroke Scale (NIHSS) score, longer hospital stay, home or rehabilitation disposition, and absence of atrial fibrillation were associated with VTE readmission. In ICH, longer hospital stay and rehabilitation disposition were associated with VTE readmission. The VTE rate was higher in ICH compared to AIS (adjusted hazard ratio 2.86, 95% confidence interval 1.93–4.25, P<0.001).
Conclusions
After stroke, VTE readmission risk is highest within the first 4–6 weeks and nearly three-fold higher after ICH vs. AIS. VTE risk is linked to decreased mobility and hypercoagulability. Studies are needed to test short-term VTE prophylaxis beyond hospitalization in high-risk patients.
Introduction
Stroke is a leading cause of mortality and morbidity [1]. Advancements in acute stroke treatments and improved inpatient stroke care have led to decreased stroke-related mortality, but patients remain at risk for secondary complications [2].
Despite current preventative strategies, clinically evident venous thromboembolism (VTE) is an important post-stroke complication that occurs in up to 5% of immobile stroke patients within the first 30-days [3] and contributes to post-stroke mortality [4]. Therefore, understanding factors associated with such complications is of paramount importance to identify patients at risk and ultimately improve therapeutic measures to reduce VTE-associated morbidity and mortality after stroke.
While current treatments such as mechanical or chemical VTE prophylaxis, are generally utilized in hospitalized stroke patients [5], quality efforts do not generally oversee the use of such measures in the post-hospitalization phase, i.e., acute rehabilitation units and skilled nursing facilities. Furthermore, in patients with high risk of major bleeding such as patients with intracerebral hemorrhage (ICH), chemical prophylaxis is considered based on risk of VTE [6], and may be avoided or delayed [7]. Therefore, it is crucial to identify patients at high-risk for VTE after their initial stroke hospitalization who may benefit from continued VTE prophylactic measures beyond their initial inpatient hospital stay. In this study, we aim to determine predictors of VTE readmissions in both hemorrhagic and ischemic stroke patients and compare VTE risk in patients with ICH to those with acute ischemic stroke (AIS).
Methods
IRB approval was waived by Lifespan Institutional Review Board since our analysis used de-identified publicly available data. Informed consent was waived by the IRB as the dataset used is a publicly available de-identified. The Nationwide Readmissions Database (NRD) used for this analysis is publicly available through the Healthcare Cost and Utilization Project (HCUP) at https://www.hcup-us.ahrq.gov/.
Patient population
We included adult patients 18 years or older hospitalized with a principal diagnosis of AIS or non-traumatic ICH using the HCUP Nationwide Database between January 1st, 2016 and December 31st, 2019. Diagnoses were identified based on ICD-10-CM (International Classification of Diseases, Tenth Revision, Clinical Modification) codes (Supplementary Table 1). For stroke, when used as a primary diagnosis, ICD-10 code has a positive predictive value of 99.8% and a sensitivity of 87.2% [8]. We excluded patients with a new VTE diagnosis at the time of index stroke admission, a prior history of VTE, and patients who died during the index admission. Due to the inability of following patients across different years, patients who were discharged from October to December were excluded each year to allow a follow-up duration of 90 days. Since we are interested in the short-term risk of a VTE readmission in stroke patients, we also excluded patients whose index admission exceeded 30 days in duration (Figure 1).

Flow chart of the study. AIS, acute ischemic stroke; ICH, intracerebral hemorrhage; VTE, venous thromboembolism. *Patients may have more than one exclusion reason.
Predictors
The variables of interest were abstracted from the list of diagnoses during the index hospitalization. These included:
(1) Demographic variables: age, sex, insurance status (Medicaid, Medicare, private insurance, and self-pay), median income by zip code (divided into quartiles according to HCUP thresholds), and hospital type (metropolitan teaching, metropolitan non-teaching, non-metropolitan).
(2) Clinical variables: history of hypertension, diabetes, cancer, congestive heart failure, obesity, and peripheral vascular disease generated with Elixhauser Comorbidity Software (Version 3.7), available on the HCUP website. History of coronary artery disease, history of atrial fibrillation or atrial flutter, National Institutes of Health Stroke Scale (NIHSS) score (continuous variable), hospital length of stay (continuous variable), and discharge disposition.
(3) In-hospital treatments: intravenous thrombolytics and mechanical thrombectomy.
Outcomes
The primary outcome was a hospital readmission within 90-days with a principal diagnosis of VTE. ICD-10 codes of pulmonary embolism and deep vein thrombosis (DVT) hospitalization were shown to have a good positive predictive value (87%) [9]. We did not consider non-principal VTE readmission in the VTE outcome since VTEs occurring during a readmission could possibly be secondary to other etiologies.
Analytical plan
Patients were divided into two groups based on the occurrence of primary outcome. We compared baseline characteristics between the two weighted groups using univariate logistic regression. We identified variables with P<0.1 from the univariate analysis and included them in weighted Cox regression analyses to determine potentially relevant predictors of the primary outcome.
We also performed weighted Cox regression with unadjusted and adjusted propensity score weighting [10] to compare the risk of VTE readmission in ICH compared to AIS. We adopted propensity score methods in combination with survey weighting in order to obtain unbiased treatment effect estimates [10]. Two different methods were used to estimate the propensity score weight. The first “propensity score matching” method utilized nearest neighbor one-to-one propensity score matching, where the matched weight was derived by multiplying the survey weights with the propensity score weights. Alternatively, the second “propensity weighted analysis” method was similar to the inverse probability of treatment weighting. Patients were re-weighted using the matched weight, which was derived by multiplying the survey weights with the doubly robust estimation weights [11]. For adjustment and weighting, we included all variables associated with VTE readmissions in Cox regression models in patients with AIS and ICH. For Cox regression models, proportionality was assessed using Schoenfeld’s residuals and parametric survival models were used when proportionality was not met.
Kaplan-Meier survival estimates were performed in both groups. Furthermore, to determine the risk of VTE over time, VTE readmission rates per day over 90-day were estimated with linear splines and the breakpoint was identified by joinpoint regression.
Finally, a risk scoring system for post-stroke VTE was developed with nomogram, which was generated using risk factors identified in Cox regression (Supplementary Table 2). NIHSS and the length of stay were dichotomized using the Youden Index cut-point. Area under the curve (AUC) was used to assess predictive accuracy. We then categorized patients into different risk groups and compared their absolute risk of post-stroke VTE readmission. All analyses were performed using Stata version 15 (StataCorp., College Station, TX, USA) and P<0.05 was considered statistically significant.
Results
Study cohort and overall VTE rates
Of the 2,288,058 patients with AIS or ICH as their principal diagnosis in their index admission, 1,459,865 met the inclusion criteria (Figure 1 depicts the study flow chart). Among the 1,330,584 included AIS patients, the mean age was 70.0±0.1 years, 49.6% (660,175/1,330,584) were women, and 3,407 (0.26%) had VTE as the principal diagnosis for readmission within 90 days of initial hospital discharge. Among the 129,281 included ICH patients, the mean age was 68.5±0.1 years, 47.9% (61,967/129,281) were women, and 0.65% (843) had VTE as the principal diagnosis for a readmission within 90 days of initial hospital discharge. The VTE readmission rate per day declined over the 90-day period and the trend significantly decelerated after day 30 for AIS patients (P<0.001) and day 46 for ICH patients (P<0.001) (Figure 2).
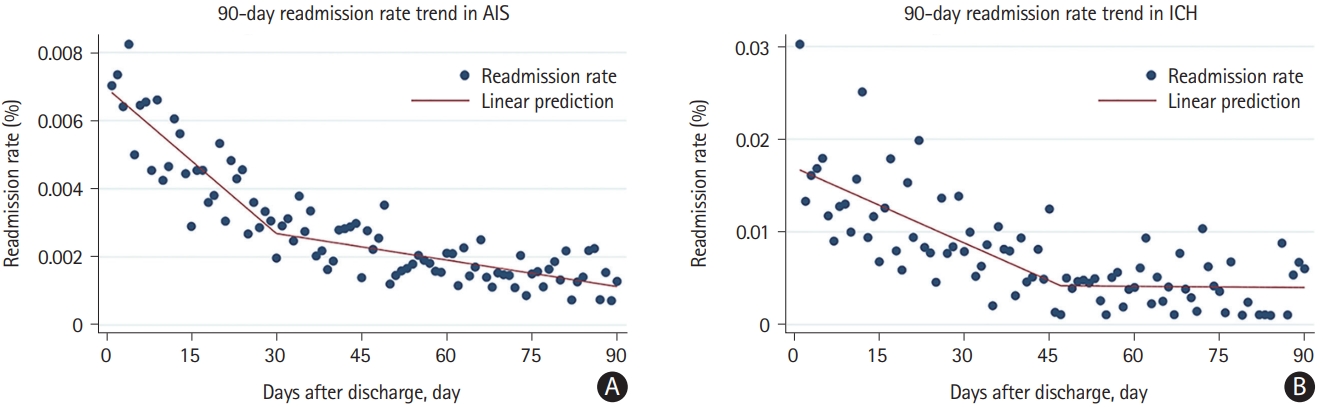
Trends in venous thromboembolism readmissions in (A) acute ischemic stroke (AIS) and (B) intracerebral hemorrhage (ICH) over 90 days.
Factors associated with VTE readmission on univariate analyses in AIS
In univariate analyses, when compared to AIS patients without a VTE readmission, those with a VTE readmission were more likely to be older (71.1±0.3 years vs. 70.0±0.1 years, P=0.002), women (54.6% vs. 49.6%, P<0.001), have a cancer diagnosis (10.8% vs. 4.0%, P<0.001), have congestive heart failure (17.6% vs. 15.5%, P=0.020), obesity (18.3% vs. 14.0%, P<0.001), have a higher NIHSS score (median [interquartile range, IQR]: 6 [3–14] vs. 4 [1–8], P<0.001), have Medicare insurance (71.7% vs. 66.7%, P<0.001), be treated at a metropolitan teaching hospital (73.1% vs. 70.6%, P=0.027), receive intravenous thrombolysis (11.2% vs. 9.4%, P=0.020), mechanical thrombectomy (5.8% vs. 3.5%, P<0.001), have a longer length of stay (median [IQR]: 5 days [3–8] vs. 3 days [2–6], P<0.001), and be discharged to a rehabilitation or skilled nursing facility (56.6% vs. 34.9%, P<0.001), and less likely to have atrial fibrillation or flutter (19.9% vs. 24.2%, P<0.001). Other characteristics were not significantly different between the two groups (Table 1).

Baseline characteristics across patients with vs. without VTE readmission in AIS and ICH
Factors associated with VTE readmission in univariate analyses in ICH
In univariate analyses, when compared to ICH patients without a VTE readmission, those with a VTE readmission were more likely to have atrial fibrillation (24.7% vs. 20.3%, P=0.048), have obesity (20.4% vs. 11.6%, P<0.001), have a higher median NIHSS score (median [IQR]: 10 [4–16] vs. 5 [2–13], P=0.001), have longer length of stay (median [IQR]: 8 days [4–14] vs. 5 days [3–11], P<0.001), and be discharged to a rehabilitation or skilled nursing facility (73.2% vs. 50.2%, P<0.001). On the contrary, VTE readmission was less common in patients in the 2nd quartile of the estimated median household income zip code (22.0% vs. 26.6%, P=0.043), home discharge (13.8% vs. 30.3%, P<0.001) or home with services discharge (10.8% vs. 16.2%, P=0.004). Other characteristics were not significantly different between the two groups (Table 1).
Factors associated with VTE readmission in AIS and ICH in Cox regression models
In Cox regression models, factors associated with increased rates of VTE readmission in patients with AIS were cancer (adjusted hazard ratios [aHR] 2.17, 95% confidence interval [CI] 1.63–2.90, P<0.001), obesity (aHR 1.73, 95% CI 1.42–2.10, P<0.001), higher NIHSS score (aHR 1.03 per point, 95% CI 1.02–1.04, P<0.001), longer hospital length of stay (aHR 1.03 per day, 95% CI 1.02–1.04, P<0.001), and disposition to home with services (aHR 1.60, 95% CI 1.22–2.11, P=0.001) or rehabilitation or nursing home (aHR 2.74, 95% CI 2.18–3.44, P<0.001) as opposed to disposition to home without services. On the other hand, atrial fibrillation was associated with a lower VTE readmission risk (aHR 0.57, 95% CI 0.45–0.71, P<0.001) (Table 2).
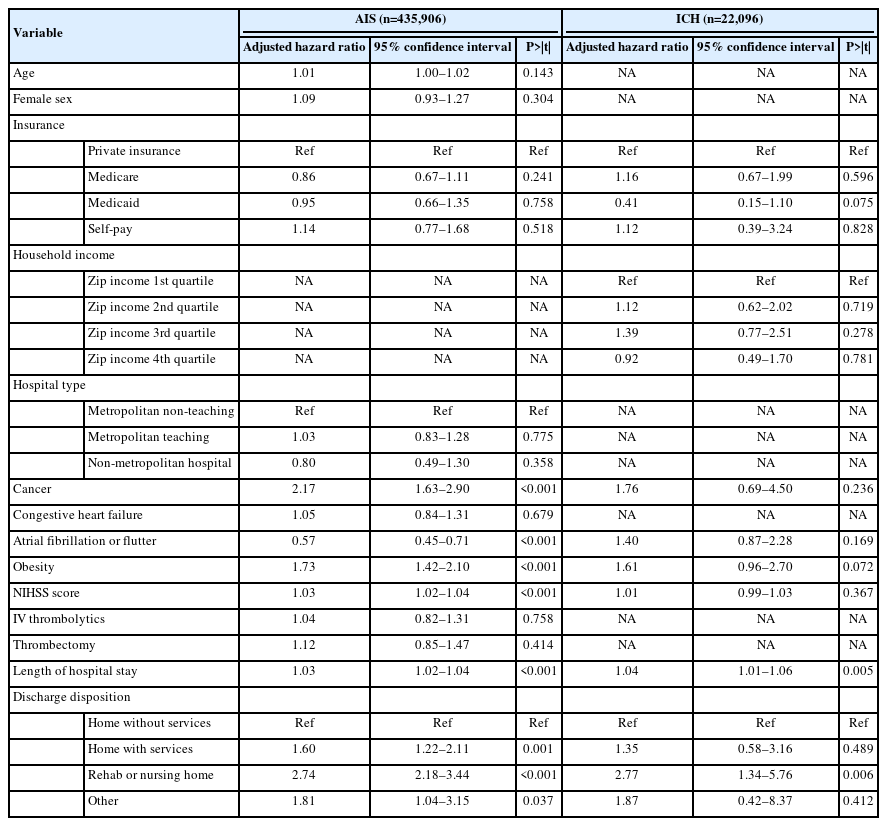
Variables associated with venous thromboembolism readmission in AIS and ICH patients in Cox regression analysis
In ICH patients, factors significantly associated with increased rates of VTE readmission were longer hospital length of stay (aHR 1.04 per day, 95% CI 1.01–1.06, P=0.005) and disposition to rehabilitation or nursing home (aHR 2.77, 95% CI 1.34–5.76, P=0.006) (Table 2).
Comparing VTE readmission risk between AIS and ICH
In the unadjusted analysis, when compared to AIS, ICH conferred a higher risk of VTE readmission (HR 2.56, 95% CI 2.28–2.87, P<0.001) (Figure 3). This finding persisted after adjusting for potential confounders (aHR 2.10, 95% CI 1.67–2.65, P<0.001), propensity score matching (aHR 1.89, 95% CI 1.34–2.66, P<0.001), and propensity weighted adjusted analyses (aHR 2.86, 95% CI 1.93–4.25, P<0.001) (Table 3).

Kaplan-Meier survival estimates of venous thromboembolism readmission in acute ischemic stroke (AIS) vs. intracerebral hemorrhage (ICH).

Association of stroke type (ICH vs. AIS) with venous thromboembolism readmission in Cox regression models
Post-stroke VTE risk score
Derived from the nomogram, the post-stroke VTE risk score (AUC: 0.70 [0.68–0.72]) used total 7 factors: ICH during index event, cancer, no history of atrial fibrillation, obesity, higher NIHSS (>4 points), longer length of stay (>3 days), and disposition to home with services, rehabilitation or nursing home. For those patients in the low (0–14), medium (15–34), and high risk (35–45) categories, the VTE readmission rates were 1,625/951,656 (0.2%), 2,617/ 507,868 (0.5%), and 8/343 (2.3%), respectively (P<0.001).
Discussion
In this nationwide analysis of post-stroke patients, we found that the 90-day risk of VTE readmission is associated with factors linked to immobility and hypercoagulability. Furthermore, the risk of VTE readmission was highest in the first 30 days in AIS and 46 days in ICH and significantly decreased thereafter.
Some of our findings differed from prior studies. For instance, atrial fibrillation was shown to be associated with VTE after ischemic stroke in prior studies [12,13]. In our study atrial fibrillation was associated with lower risk of post-stroke VTE. The prior studies were conducted in the early 1990s when only 1.5% of their patients were treated with anticoagulation [13]. In current practice, these rates are substantially higher, particularly with anticoagulation by discharge being a joint commission quality measure in AIS patients with atrial fibrillation. Therefore, early initiation of oral anticoagulation in patients with atrial fibrillation according to current joint commission quality measures may be an important driver of reduced VTE risk in such patients. This notion is further supported by our observation that atrial fibrillation was not independently associated with VTE readmission risk after ICH, presumably because in such patients, initiation of oral anticoagulation may be delayed or considered contraindicated depending on the ICH etiology. Which again implies that the lower risk of VTE in atrial fibrillation patients may be due to anticoagulation therapy. Furthermore, the association between cancer and VTE risk in stroke patients is in line with studies suggesting the occurrence of hypercoagulability in the setting of cancer [14,15], which increases the risk of VTE [16]. Moreover, many risk factors for VTE readmission in our study have previously been linked to impaired mobility, such as increased hospital length of stay, stroke severity, discharge to a rehabilitation or skilled nursing facility, and obesity [17-20]. That said, there may be surveillance bias for facility disposition where VTE patients may more likely be sent to the hospital, and this finding should be interpreted with caution. Several studies have investigated extended VTE prophylaxis use in acutely ill medical patients and demonstrated decreased rate of VTE at a cost of increased rate of major bleeding. Stroke patients may have different coagulopathy (inherent disease or medication) and immobility than acutely ill medical patients. Further studies in this special subgroup patients are needed to test interventions such as early mobilization of stroke patients [21], reducing the length of hospital stay to reduce the VTE rates, shortterm use of mechanical and/or chemical DVT prophylaxis after hospital discharge, particularly in high-risk patients. Furthermore, standard doses of chemical prophylactic agents may not be as effective in obese patients [19,22].
Similar to prior studies [23,24], our study also showed that the risk of VTE was three-fold higher in ICH patients when compared to those with AIS. One possible explanation is the lower rates and delay in initiation of chemical VTE prophylaxis in ICH compared to AIS. Despite guidelines recommending chemical prophylaxis to be initiated between 1 and 4 days after ICH onset provided cessation of active bleeding [7], one study showed that less than 20% of patients with ICH received chemical VTE prophylaxis, of whom less than half of them received it within 2 days after ICH onset [24]. Patients with ICH are also more likely to require an intensive care unit admission, have higher morbidity, and have a longer length of hospital stay than patients with AIS, all of which may contribute to the higher risk of VTE in patients with ICH compared to those with AIS. Nevertheless, our findings suggesting higher rates of VTE in ICH patients persisted even after adjusting for these factors.
Finally, we found that rates of VTE are highest during the first 30 days after ischemic stroke and 46 days from ICH, which is consistent with prior studies [25,26]. This is in line with findings from prior studies showing the risk of VTE in stroke patients extends into the acute rehabilitation phase [12,27]. Thus studies are needed to investigate the efficacy and safety of continued mechanical and chemical prophylaxis beyond the hospital setting in high-risk patients and up to these time points with AIS and ICH. Furthermore, given the risk of VTE is significantly lower beyond these time points, long-term chemical or mechanical prophylaxis may not be beneficial and is not recommended by clinical guidelines [28].
There are several limitations to our study. Although this national database allows analysis of a very large number of patients, it lacks specific patient-level data. For example, despite accounting for multiple comorbidities, certain clinically relevant measures such as the use of anticoagulation and intermittent pneumatic compression are not available in this dataset. The national readmission database only provides disposition in limited categories, and it combines acute rehabilitation and skilled nursing facilities into one category. This is particularly important as patients who were discharged to long-term care have the most disability and the least potential for a good recovery than those discharged to acute rehabilitation. That said, the general criteria for discharge to acute rehabilitation are being unable to walk independently even with the use of an assistive device, which would imply a modified Rankin Scale score of 4 or 5 and thus have decreased mobility and are still at risk for VTE.
Importantly, we only considered patients who were hospitalized with VTE, and thus VTEs diagnosed and treated in the outpatient setting were not included. The rate of post-stroke VTE was reported to be up to 17% for asymptomatic and symptomatic patients and about 1% for clinically relevant events in prior studies [29,30]. Furthermore, patients with sudden death from an undiagnosed pulmonary embolus were also not included. These factors may have contributed to a lower rate of VTE in our study compared to prior studies [3]. Another limitation of our study is the exclusion of patients hospitalized between October and December. We however do not expect the variables and findings used in this study to vary based on this exclusion.
Conclusion
Although patients with stroke have a low rate of readmission for VTE, ICH and factors related to decreased mobility and/or hypercoagulability can put them at a higher risk of VTE. Further studies are needed to determine whether early mobilization and mechanical and/or short-term chemical prophylaxis post-discharge reduce the risk in high-risk patients.
Supplementary materials
Supplementary materials related to this article can be found online at https://doi.org/10.5853/jos.2022.02215.
Diagnoses based on International Classification of Diseases, Tenth Revision (ICD-10) code
Post-stroke venous thromboembolism score
Notes
Disclosure
The authors have no financial conflicts of interest.
Acknowledgements
None