J Stroke Search

CLOSE


J Stroke > Volume 26(1); 2024 > Article
Namgung, Lee, Kim, and Kang: White Matter Structural Connectivity Associated With Visual Field Recovery After Stroke
Dear Sir:
Visual field defect (VFD) commonly manifests as an impairment in visuospatial function after occipital stroke, hampering overall function [1]. Unveiling the brain mechanisms underlying spontaneous visual field recovery in acute stroke would facilitate the development of effective treatment strategies for stroke-induced VFD [2]. White matter connectivity of the visual cortex may be crucial for visuospatial function and visual field recovery [2-4]. In contrast to functional connectivity, structural connectivity in the visual cortex underlying spontaneous visual field recovery after stroke has received little attention [5]. Therefore, we hypothesized and assessed whether structural connectivity of the visual cortex is related to spontaneous recovery from VFD in acute ischemic stroke.
The Institutional Review Board of Asan Medical Center approved this study (IRB No. 2011-0538 and 2012-0097). Participants included VFD patients with acute ischemic stroke (n=21), who were selected from a previous study as those having consistent diffusion tensor imaging (DTI) acquisition parameters across three visits and with those of other patients [5]. Written informed consent was obtained from each participant. Within four time points (1 week, 1 month, 3 months, and 6 months after stroke onset), Humphrey Visual Field tests (Swedish Interactive Threshold Algorithm [SITA]-Fast 30-2) were used to measure the mean total deviation (MTD) scores in the affected visual hemifield-light detection performance averaged for two eyes relative to the age-matched normal values. T1-weighted images and DTI were acquired using a brain magnetic resonance imaging scanner (3.0 T Philips Achieva; Philips Medical Systems, Amsterdam, the Netherlands) and used to measure fractional anisotropy (FA) and mean diffusivity (MD) values in the nine white matter tracts connecting the visual cortex at three time points (1 week, 1 month, and 3 months after stroke onset) (Supplementary Figure 1). Changes in the MTD, FA, and MD values over time and their correlations were assessed using statistical analyses. The detailed acquisition and analysis are provided in the Supplementary Methods.
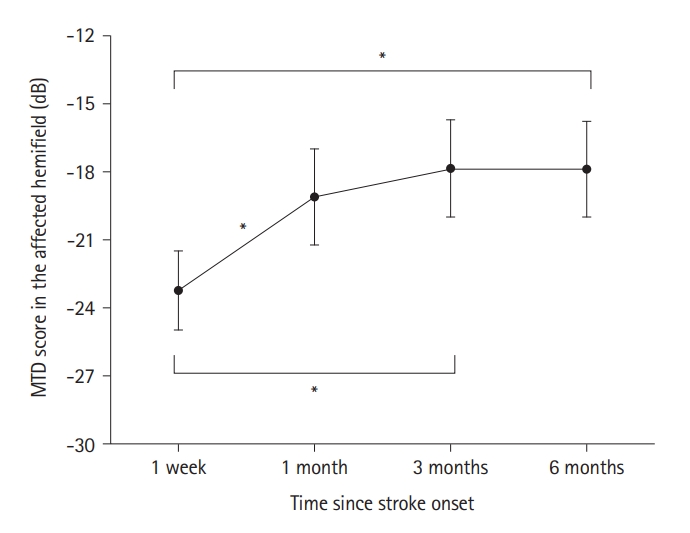
Demographic and clinical characteristics of patients with VFD are presented in Supplementary Table 1. MTD scores in the affected hemifield changed significantly between the four time points. At Bonferroni-corrected P value, the MTD scores improved between 1 week and 1 month (P<0.001; change=4.13±4.81 dB), 1 week and 3 months (P<0.001; change=5.37±5.91 dB), and 1 week and 6 months after stroke (P<0.001; change=5.34±4.97 dB). However, the changes between 1 and 3 months (P=0.029), 1 and 6 months (P=0.031), and 3 and 6 months (P=0.950) did not survive Bonferroni correction (Figure 1, Supplementary Table 2).
Among the nine white matter tracts connecting the visual cortex, the FA values significantly changed in seven white matter tracts between the three time points (Supplementary Table 3). The FA values significantly decreased between 1 week and 1 month and between 1 week and 3 months after stroke onset for the following six white matter tracts: forceps major, contralesional inferior fronto-occipital fasciculus, contralesional inferior longitudinal fasciculus (ILF), ipsilesional ILF, contralesional superior longitudinal fasciculus (SLF), and ipsilesional SLF (temporal part) (Figure 2).
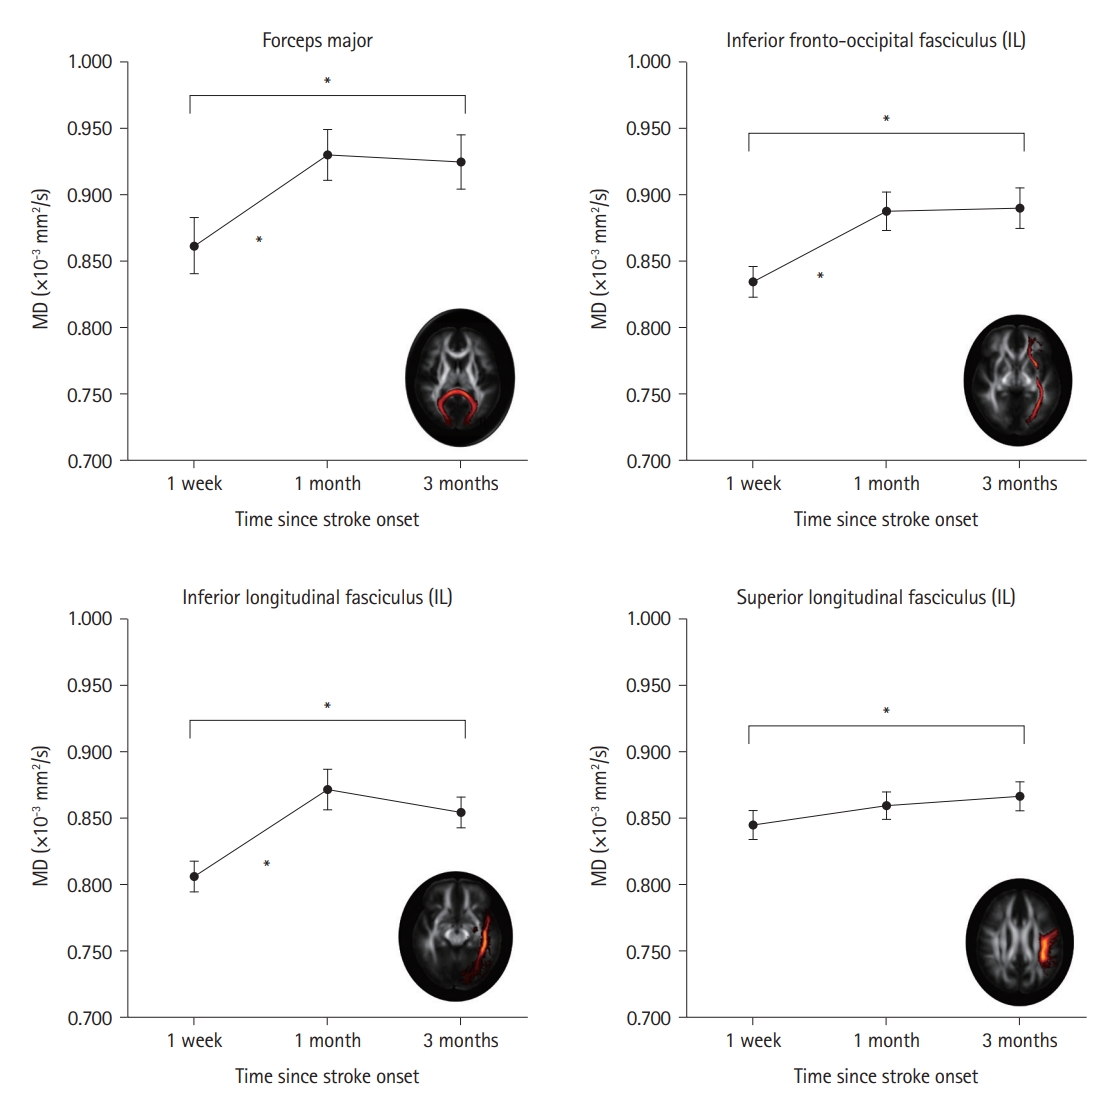
The MD values changed significantly in the four tracts among the three time points (Supplementary Table 4). The MD values of the four tracts (forceps major, ipsilesional inferior fronto-occipital fasciculus, ipsilesional ILF, and ipsilesional SLF) significantly increased between the initial (1 week) and final (3 months) assessment time points. Among these, MD values significantly increased between 1 week and 1 month after onset in three tracts (forceps major, ipsilesional inferior fronto-occipital fasciculus, and ipsilesional ILF) (Figure 3).
Changed FA of the contralesional ILF (β=0.586, uncorrected P=0.006) and ipsilesional SLF, temporal part (β=0.469, uncorrected P=0.045) between 1 week and 3 months was positively correlated with changed MTD scores in the affected hemifield between 1 week and 6 months (Supplementary Table 5). Changed MD of the ipsilesional ILF (β=-0.433, uncorrected P=0.034) between 1 week and 1 month was negatively correlated with changed MTD scores between 1 week and 6 months (Supplementary Table 6). Changed MD of the ipsilesional ILF (between 1 week and 1 month) was negatively correlated with changed FA of the contralesional ILF (between 1 week and 3 months) (β=-0.350, Bonferroni-corrected P=0.014) (Supplementary Table 7).
We evaluated the natural trajectory of spontaneous recovery from VFD and the brain structural connectivity in patients with acute ischemic stroke. There was considerable visual field recovery within the first month, with gradually decreasing magnitude until 6 months after stroke [2,6]. Nevertheless, MD increase in the ipsilesional tracts and FA decrease in the overall tracts of the visual cortex were observed mostly within the first month, reflecting edema related to acute ischemic stroke [7,8]. Despite prominent visual field recovery within the first month, edema may still occur, as shown by decreased FA and increased MD [7,9]. Our negative correlation between 1-month ipsilesional MD changes and 3-month contralesional FA changes of the ILF is consistent with timing of acute stroke-related diffusivity changes: acute intracellular edema (changes in MD), followed by subacute extracellular edema (changes in FA) [7,8]. Importantly, less MD increase in the ipsilesional occipitotemporal tract (ILF) during the first month and less FA decrease in the bilateral occipitotemporal tracts (ILF, SLF) up to 3 months were correlated with greater visual field recovery up to 6 months after onset [7,9]. The occipitotemporal tracts involved in visual perception [3,10], connecting the visual cortex with the temporal regions, may recover from intracellular edema during the first month and from extracellular edema during 3 months, leading to visual field recovery during 6 months after onset [2,7,9].
The current study had a few limitations, including the small number of patients, lack of a control group, lack of consideration of patient confounding variables, and predefined analysis of the visual cortex. Future larger studies adjusting for the potential confounding effects of patient characteristics may distinguish structural changes underlying visual field recovery from changes due to natural aging and stroke pathology [2,9]. Nevertheless, our findings suggest that early FA or MD changes in the white matter tracts between the visual cortex and temporal regions, indicating recovery from stroke-related edema, may be related to later spontaneous recovery from VFD.

Supplementary materials

Supplementary materials related to this article can be found online at https://doi.org/10.5853/jos.2023.02222.
Supplementary Table 1.
Demographic and clinical characteristics of study participants
jos-2023-02222-Supplementary-Table-1.pdf
Supplementary Table 2.
MTD changes in the affected hemifield between four time points
jos-2023-02222-Supplementary-Table-2.pdf
Supplementary Table 3.
FA changes in the white matter tracts connecting the visual cortex
jos-2023-02222-Supplementary-Table-3.pdf
Supplementary Table 4.
MD changes in the white matter tracts connecting the visual cortex
jos-2023-02222-Supplementary-Table-4.pdf
Supplementary Table 5.
Relationship between significant FA changes and changes in MTD scores over 6 months
jos-2023-02222-Supplementary-Table-5.pdf
Supplementary Table 6.
Relationships between significant MD changes and changes in MTD scores over 6 months
jos-2023-02222-Supplementary-Table-6.pdf
Supplementary Table 7.
Relationships between significant MD changes and significant FA changes
jos-2023-02222-Supplementary-Table-7.pdf
Supplementary Figure 1.
Nine white matter tracts involving the visual cortex included in the analysis. Nine white matter tracts involving the visual cortex were included in the analysis and are indicated as a red-to-yellow map overlaid on the white matter tractography atlas. Montreal Neurological Institute (MNI) coordinates are also indicated. The fractional anisotropy (FA) and mean diffusivity (MD) values in the nine white matter tracts were extracted at three assessment points (1 week, 1 month, and 3 months after stroke onset) for the participants (n=21) included in the final analysis. CL, contralesional; IL, ipsilesional.
jos-2023-02222-Supplementary-Fig-1.pdf

Notes

Funding statement
This research was supported by a grant from the Korea Health Technology R&D Project through the Korea Health Industry Development Institute (KHIDI) funded by the Ministry of Health & Welfare (HR18C0016), and by a grant from the National Research Foundation of Korea (NRF) funded by the Korean government (MSIT) (2022R1F1A1060778), Republic of Korea.
Conflicts of interest
The authors have no financial conflicts of interest.
Author contribution
Conceptualization: EN, YHK, DWK. Study design: EN, DWK. Methodology: EN, DWK. Data collection: YHK, EJL. Investigation: YHK, EJL. Statistical analysis: EN, EJL. Writing—original draft: EN, DWK. Writing—review & editing: EJL, YHK. Funding acquisition: EN, DWK. Approval of final manuscript: all authors.

Figure 1.
Changes in the MTD scores of the affected hemifield. The MTD scores in the affected hemifield were compared at 1 week, 1, 3, and 6 months after stroke onset using one-way repeated-measures analysis of variance. For post hoc analyses, MTD scores were compared between six pairs of four time points using a Bonferroni-corrected paired t-test with 6 comparisons. The black circles indicate the mean of the MTD scores and the error bars indicate the standard error of the mean. MTD, mean total deviation. *Statistical significance using Bonferroni-corrected paired t-test.
jos-2023-02222f1.jpg
Figure 2.
Changes in the FA of the white matter tracts. FA changes in the nine white matter tracts connecting the visual cortex were compared between 1 week, 1 month, and 3 months after stroke onset using one-way repeated-measures analysis of variance. For post hoc analyses, the FA values in the seven tracts with significant changes were compared between three pairs of three time points using the Bonferroni-corrected paired t-tests, with 21 comparisons. The six tracts showed significant temporal changes in the Bonferroni-corrected paired t-tests, as indicated by * symbols. The black circles indicate the mean FA values, and the error bars indicate the standard error of the mean. FA, fractional anisotropy; CL, contralesional; IL, ipsilesional.
jos-2023-02222f2.jpg
Figure 3.
Changes in the MD of the white matter tracts. The MD changes in the nine white matter tracts connecting the visual cortex were compared at 1 week, 1 month, and 3 months after stroke onset using one-way repeated-measures analysis of variance. For post hoc analyses, the MD values in the four tracts with significant changes were compared between three pairs of three time points using the Bonferroni-corrected paired t-tests, with 12 comparisons. The four tracts showed significant temporal changes using Bonferroni-corrected paired t-tests, as indicated by the * symbols. The black circles indicate the mean MD values, and the error bars indicate the standard error of the mean. IL, ipsilesional; MD, mean diffusivity.
jos-2023-02222f3.jpg

References

1. Rowe FJ, Hepworth LR, Howard C, Hanna KL, Cheyne CP, Currie J. High incidence and prevalence of visual problems after acute stroke: an epidemiology study with implications for service delivery. PLoS One 2019;14:e0213035.
crossref pmid pmc
2. Urbanski M, Coubard OA, Bourlon C. Visualizing the blind brain: brain imaging of visual field defects from early recovery to rehabilitation techniques. Front Integr Neurosci 2014;8:74.
crossref pmid pmc
3. Kang DW, Kim D, Chang LH, Kim YH, Takahashi E, Cain MS, et al. Structural and functional connectivity changes beyond visual cortex in a later phase of visual perceptual learning. Sci Rep 2018;8:5186.
crossref pmid pmc pdf
4. Kim YH, Kang DW, Kim D, Kim HJ, Sasaki Y, Watanabe T. Real-time strategy video game experience and visual perceptual learning. J Neurosci 2015;35:10485-10492.
crossref pmid pmc
5. Kim YH, Cho AH, Kim D, Kim SM, Lim HT, Kwon SU, et al. Early functional connectivity predicts recovery from visual field defects after stroke. J Stroke 2019;21:207-216.
crossref pmid pmc pdf
6. Zhang X, Kedar S, Lynn M, Newman N, Biousse V. Homonymous hemianopias: clinical-anatomic correlations in 904 cases. Neurology 2006;66:906-910.
crossref pmid
7. García AO, Brambati SM, Desautels A, Marcotte K. Timing stroke: a review on stroke pathophysiology and its influence over time on diffusion measures. J Neurol Sci 2022;441:120377.
crossref pmid
8. Kern KC, Wright CB, Leigh R. Global changes in diffusion tensor imaging during acute ischemic stroke and post-stroke cognitive performance. J Cereb Blood Flow Metab 2022;42:1854-1866.
crossref pmid pmc pdf
9. Pinter D, Gattringer T, Fandler-Höfler S, Kneihsl M, Eppinger S, Deutschmann H, et al. Early progressive changes in white matter integrity are associated with stroke recovery. Transl Stroke Res 2020;11:1264-1272.
crossref pmid pmc pdf
10. Ortibus E, Verhoeven J, Sunaert S, Casteels I, De Cock P, Lagae L. Integrity of the inferior longitudinal fasciculus and impaired object recognition in children: a diffusion tensor imaging study. Dev Med Child Neurol 2012;54:38-43.
crossref pmid


ABOUT JoS
AUTHOR INFORMATION
ARTICLE CATEGORY

Browse all articles >

BROWSE ARTICLES
Editorial Office
Department of Neurology, Asan Medical Center,Ulsan University College of Medicine
88, Olympic-ro 43-gil, Songpa-gu, Seoul 05505, Korea
Submission, status and progress, etc ⟫ E-mail: editor@j-stroke.org
Website and system ⟫ E-mail: journal@m2community.co.kr
Publishing company ⟫ E-mail: ka72sus@smileml.com
Developed in M2PI
Copyright © 2024 by Korean Stroke Society.
Close layer
prev next