Association of Optimal Combination Drug Treatment with Obesity Status among Recent Ischemic Stroke Patients: Results of the Vitamin Intervention for Stroke Prevention (VISP) Trial
Article information
Abstract
Background and Purpose
One explanation for the ‘obesity paradox’, where obese patients seem to have better cardiovascular outcomes than lean patients, is that obese patients display an identifiable high cardiovascular risk phenotype that may lead to receiving or seeking earlier/more aggressive treatment.
Methods
We analyzed a clinical trial dataset comprising 3643 recent (<120 days) ischemic stroke patients followed up for 2 years. Subjects were categorized as lean (body mass index [BMI], <25 kg/m2, n=1,006), overweight (25-29.9 kg/m2, n=1,493), or obese (≥30 kg/m2, n=1,144). Subjects were classified as level 0 to III depending on the number of secondary prevention prescriptions divided by the number of potentially indicated drugs (0=none of the indicated medications and III=all indicated medications as optimal combination drug treatment [OCT]). Independent associations between each BMI category and stroke/myocardial infarction/vascular death (major vascular events [MVEs]) and all-cause death were assessed.
Results
MVEs occurred in 17.4% of lean, 16.1% of overweight, and 17.1% of obese patients; death occurred in 7.3%, 5.5%, and 5.1%, respectively. Individuals with a higher BMI status received more OCT (45.8%, 51.7%, and 55.3%, respectively; P<0.001). In the lean patient group, multivariable adjusted Cox analyses, showed that compared with levels 0-I, level II and level III were linked to lower risk of MVEs (hazard ratio [HR] 0.55; 95% confidence interval [CI]: 0.32–0.95 and HR 0.48; 95% CI: 0.28−0.83, respectively) and death (0.44; 0.21–0.96 and 0.23; 0.10−0.54, respectively).
Conclusions
OCT for secondary prevention after an ischemic stroke is less frequent in lean (vs. obese) subjects, but when implemented is related to significantly better clinical outcomes.
Introduction
Several studies indicate that there is an obesity paradox for stroke, whereby post-stroke patients are unexpectedly prone to have poor survival rates or more major vascular events if they are lean than if they are obese [1-3]. Various explanations have been proposed for this paradox including that obese patients display a readily identifiable high cardiovascular risk phenotype that may lead to their receiving or seeking earlier/more aggressive treatment, thereby changing the course of the disease when compared with lean patients [4].
Mounting evidence suggests that the systematic combining of individually proven secondary prevention drugs may improve cardiovascular outcomes [5-7]. Indeed, a recently published study found that the optimal combination drug treatment (OCT) for secondary prevention after a recent stroke was broadly associated with a significantly lower risk of vascular events [8,9]. If lean stroke survivors are actually receiving or seeking later/less aggressive treatment than obese stroke patients, OCT may have a differentially beneficial effect for lean stroke survivors.
With this background, we investigated whether lean stroke patients are less likely than are obese patients to receive OCT, and then evaluated whether the OCT level is likely to explain, at least in part, the difference in the event rates by obesity status.
Methods
Patients and setting
We reviewed data from the Vitamin Intervention for Stroke Prevention (VISP) trial [10], a multicenter, double blind, randomized controlled clinical trial performed at 56 centers across the United States, Canada, and Scotland. The study enrolled 3,680 patients aged ≥35 years to determine whether high doses of a multivitamin (folic acid, pyridoxine, and cobalamin) administered to lower total homocysteine levels would reduce the risk of recurrent stroke and major vascular events in patients with a recent (<120 days) non-cardioembolic stroke [10]. Details of the methods and main results of the trial have been reported previously [10]. Demographic, clinical, and laboratory data were collected at baseline, with subsequent clinical and laboratory information obtained at follow-up visits of 1, 6, 12, 18, and 24 months [10]. For each patient, the presence of hypertension and diabetes was documented not only by history, but also if newly diagnosed at the time of the first visit. Body mass index (BMI), calculated as weight in kilograms divided by square of height in meters, was retrieved at the baseline visit. We also reviewed the recorded VISP data pertaining to secondary prevention drug information, including antihypertensive (AH), antithrombotic (AT; antiplatelet/anticoagulation), and lipid-modifying therapies (LM; statins mostly), which was collected at every 6-month interval follow-up visit. Drug information was utilized at the last follow-up visit as reported previously [8]. The AH was further analyzed according to drug class (i.e., renin-angiotensin system [RAS] modulator, calcium antagonist, β-blocker, diuretic, or/and α-blocker). The trial was approved by the ethics committee or institutional review board at each national or local site, and all participants provided written informed consent prior to enrollment [10].
Assessment of outcomes
The primary outcome for this analysis was a composite of stroke; coronary heart disease (CHD) including myocardial infarction, coronary revascularization, cardiac resuscitation, and fatal CHD, or vascular death defined as major vascular events (MVEs). The secondary outcome was death of any cause. Each adjudicated endpoint in VISP was verified through the consensus of a review committee [10].
Statistical analysis
Data are summarized as mean±standard deviation or number of subjects (percentage), as appropriate. Comparisons across the groups were examined using the χ2 test for categorical variables, and the one-way analysis of variance, followed by the Dunnett test for multiple comparisons, for continuous variables. For the purpose of this analysis, VISP subjects were divided into 3 groups based on recognized BMI categories of general adiposity [11]: (1) individuals with BMI ≥30 kg/m2 as obese; (2) individuals with BMI 25 to 29.9 kg/m2 as overweight; and (3) individuals with BMI <25 kg/m2 as lean. BMI was also assessed as a continuous variable. The frequency of OCT by obesity status was evaluated using a χ2 linear-by-linear association test. The lowest BMI category was the referent group for the purposes of comparison. Cox proportional hazard regression analyses were performed to estimate the risk of outcome events at 2 years after adjusting for age, sex, mini-mental state examination (MMSE) score, systolic blood pressure, hypertension, diabetes, ethnicity, smoking, serum levels of total cholesterol, triglycerides, high-density lipoprotein cholesterol (HDL-C), and creatinine, history of heart failure (HF), history of alcohol use, use of AH, LM (all P<0.01), and AT, stroke severity, history of stroke, history of CHD, and history of carotid endarterectomy, all of which could potentially affect cardiovascular recurrence or death, regardless of statistical significance (model I). The vascular prevention therapies of AH, LM, and AT were likely to affect the event rate during the follow-up period. Therefore, to adjust baseline characteristics only, we additionally conducted multivariable analyses (model II), which included all covariates of model I, except for the variables of AH use, LM use, and AT use. VISP qualifying stroke was not included in the history of stroke. Expert consensus practice guidelines for secondary stroke prevention recommend the use of antiplatelet medication and statin therapy, and antihypertensive medication in the case of established or newly diagnosed hypertension [12]. We also reviewed secondary prevention classes (levels 0 to III) using an appropriateness algorithm for various secondary prevention strategies based on a previous study [13]. Composite OCT level was determined for each patient as follows: level 0, none of the indicated medications were prescribed; level I, 1 medication was prescribed even though 3 medications were indicated; level II, 2 medications were prescribed even though 3 medications were indicated or 1 medication was prescribed even though 2 medications were indicated; and level III, all indicated medications were prescribed (AH+AT+LM) as the OCT. If a patient did not have a diagnosis of hypertension and was prescribed both of the other 2 indicated medication classes (AT+LM), that patient’s appropriateness was defined as level III. Baseline demographic and clinical covariates were preselected according to previous studies of factors that influence vascular events after ischemic stroke. We then investigated the impact of OCT in VISP subjects stratified by obesity status. Cox proportional hazard regression analyses were performed to estimate the risk of outcome events after multivariable adjustment. Participants who did not experience outcome events were censored at the last follow-up examination, or the last visit. Participants lost to follow-up during the course of the study were included in the Cox model until the date of last contact. Results were expressed by hazard ratios (HRs) with 95% confidence intervals (CIs). To determine whether the effect of increasing OTC levels on event rates would differ across the BMI categories, we explored the regression slope for the HR of the primary and secondary endpoints by increasing the OCT levels in each BMI category. The equivalence of regression slopes for the HRs of the endpoints across BMI categories was tested by including interaction terms between BMI category and OCT level, the latter as a continuous variable, in the Cox model. A significant interaction P-value indicated that the regression slopes across the BMI categories were not parallel. Analyses were carried out with IBM SPSS Version 22.0 (IBM Corp., Armonk, NY, USA) and survival curves were fit by the log-rank tests using MedCalc software version 5.0 (Mariakerke, Belgium). A probability value of <0.05 was considered statistically significant.
Results
Subjects characteristics and incidence of outcome events by obesity status
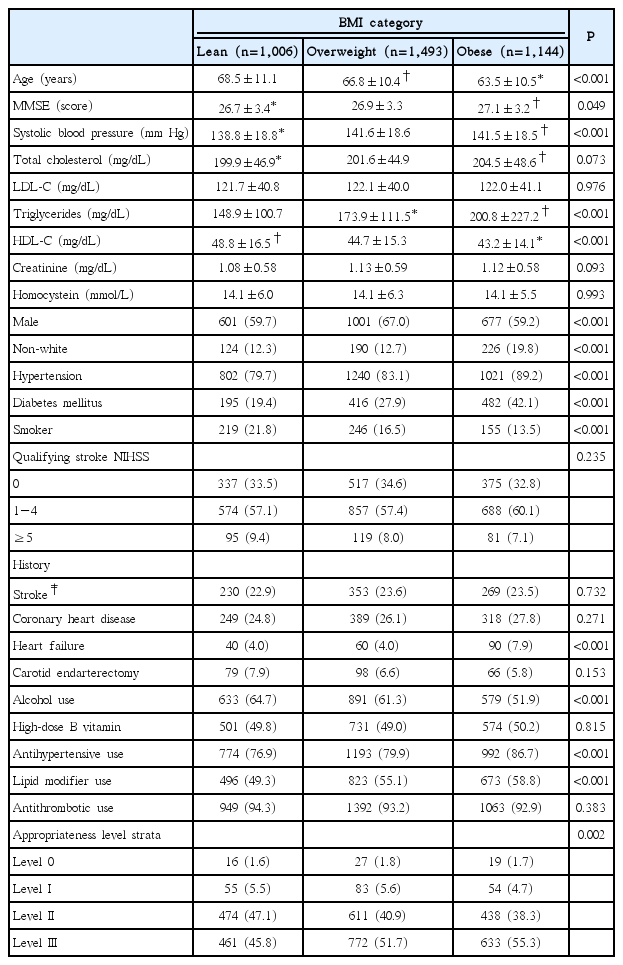
Of 3,680 individuals enrolled in VISP, 37 individuals (1%) had missing BMI values and were excluded from the final analysis, yielding a total of 3,643 subjects (mean age, 66.3±10.8 years; women in 37.4%; and white in 79.5%). For secondary stroke prevention, 81% received AH, 54.7% LM, and 93.4% AT. Overall, 51.2% of total subjects received OCT (level III). Baseline demographic and clinical characteristics by BMI category are provided in Table 1. Compared with lean stroke patients, obese patients were younger, had higher levels of systolic blood pressure, triglycerides, and had higher rates of non-white patients, hypertension, diabetes mellitus, AH use, and LM use, as well as history of HF. Moreover, obese patients were more likely to have higher MMSE scores, total cholesterol, and creatinine, whereas HDL-C level, smoking frequency, and history of alcohol use were lower in that group. The overweight group had a higher proportion of males. Notably, individuals with higher BMI statuses received more OCT. Supplementary Table 1 shows the frequencies of AH prescribed by drug classes among the 3,643 study subjects (class 1, RAS modulator; class 2, RAS modulator+beta-blocker (BB); class 3, RAS modulator+calcium channel blocker (CCB); class 4, BB; class 5, CCB; class 6, diuretics; and class 7, other). The frequencies of each AH class by obesity status are shown in Supplementary Table 2. Interestingly, the proportion of patients treated with RAS modulator+CCB combination therapy was 18.1% among lean stroke patients receiving AH therapy, which was lower than that among the overweight and obese patients. Additionally, just 15.8% of the obese stroke patients receiving AH therapy were treated with RAS modulator+BB combination therapy.
Effect of BMI category on outcome events
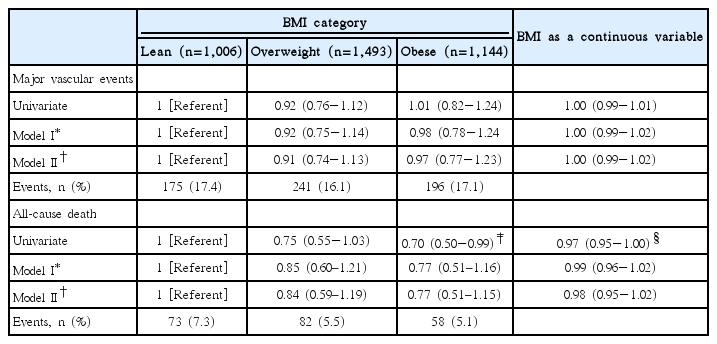
During an average 20 months of follow-up, a total of 612 (16.8%) MVEs and 213 (5.8%) all-cause deaths were recorded. Rates of MVEs and all-cause death were more likely to be higher in lean stroke patients (Table 2). Table 2 also provides the results of the unadjusted and adjusted associations of both BMI category and BMI, as continuous variables, with outcome events. In unadjusted analyses, occurrence of MVEs was not significantly lower in obese patients when compared to lean patients. Occurrence of death was lower in obese patients (HR 0.70; 95% CI, 0.50−0.99; P=0.034) compared with lean patients, but this association was subsequently attenuated in multivariable Cox models. Higher BMI as a continuous variable was significantly associated with a decreased occurrence of MVEs (HR 0.97; 95% CI, 0.95-1.00; P=0.026), though its significance disappeared after multivariable adjustment. These null associations remained constant even in model II, which excluded the variables of AH use, LM use, and AT use during the trial that were expected to impact event rates.
Adjusted effect of secondary prevention medication classes on outcome events by obesity status
Table 3 shows the multivariable risk adjusted effect of secondary prevention OCT on the 2-year risk of outcome events by appropriateness strata. Level 0 and I were merged and considered the referent group because of the small number of patients in the level 0 group. For lean patients in the level II and III groups, when compared with the referent group, the adjusted HR for MVEs was 0.55 (95% CI, 0.32–0.95; P=0.032) and 0.48 (95% CI, 0.28–0.83; P=0.009), respectively. Risk of death was lower in the level II (HR 0.44, 95% CI, 0.21–0.96; P=0.038) and level III groups (HR 0.23, 95% CI, 0.10–0.54; P=0.001). The adjusted HR for MVEs in the level III group was 0.54 (95% CI, 0.33–0.87; P=0.011) for overweight patients, while that for death events in the level III group was 0.32 (95% CI, 0.11–0.94; P=0.038) for obese patients, when compared with referent group. Patterns of the regression slope for the HRs of the primary (A) and secondary endpoints (B) by increasing OCT levels in each BMI category are shown in Figure 1. The regression slopes for the HRs across BMI categories were parallel. Interaction P-values of the slopes were 0.853 for MVEs and P=0.133 for all-cause death between the lean and overweight patients; P=0.584 and P=0.759, respectively, between the lean and obese patients; and P=0.687 and P=0.072, respectively, between the overweight and obese patients. The decreasing pattern of HRs by increasing OCT levels differed slightly in the overweight and obese patients for all-cause death, but the difference was not statistically significant. The Kaplan-Meier curves for the MVEs endpoint in the lean (A), overweight (B), and obese patients (C) over the 2-year follow-up period depicted low probability of MVEs occurrence in the lean and overweight stroke patients according to OCT (level III), with P=0.0131 and P=0.0185, respectively, by log-rank test (Figure 2). Figure 3 shows the Kaplan-Meier curves for the endpoint of all-cause death in the lean (A), overweight (B), and obese patients (C), which revealed a risk reduction by OCT in the lean and obese stroke patients (P=0.0011 and P=0.0006, respectively, by log-rank test). As shown in Table 3, the risk reduction of MVEs/all-cause death in the level III group was more likely to be greater (52%/77%) in the lean group than in both the overweight group (46%/39%) and the obese group (36%/68%). Accordingly, the rate of death in the level 0/I group was higher in the lean group (P=0.041), and both of the event rates in the level III group were not significantly different across BMI categories (Supplementary Figure 1). The adjusted HRs of the covariates included in the multivariable Cox model by each BMI category are shown in Supplementary Tables 3–5. In lean stroke patients, diabetes mellitus and history of CHD were significantly associated with increased risk of MVEs, whereas history of HF was associated with an increased risk of both MVEs and death in obese patients. In overweight patients, diabetes mellitus and elevated creatinine levels were significantly linked to an increased risk of both MVEs and death. In terms of the stroke endpoint, the effect of OCT (level III) on the risk reduction of ischemic stroke was significant in the overweight stroke patients (adjusted HR 0.50, 95% CI, 0.25–0.98; P=0.042), but not in the lean stroke patients (Supplementary Table 6).
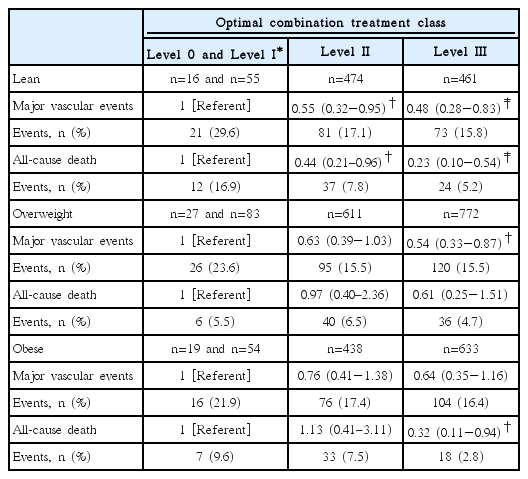
Multivariate risk adjusted effect of secondary prevention medication classes (level 0-I to III) on risk of vascular outcome and death by body mass index (BMI) categories at 2 years
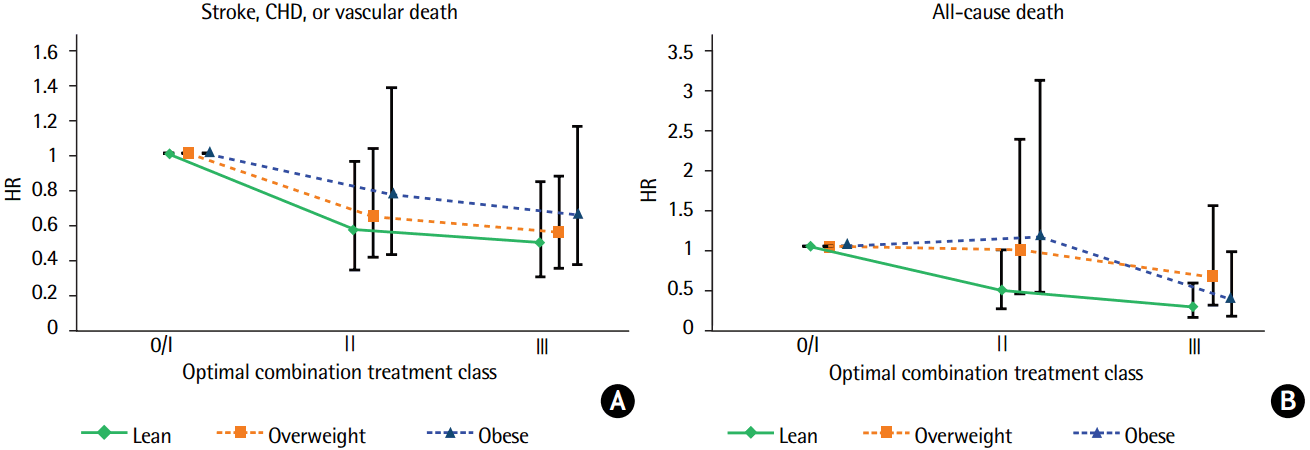
Patterns of the regression slope for the HR of MVEs (A) and all-cause death (B) according to increasing OCT levels in each BMI category. CHD, coronary heart disease; HR, hazard ratio; MVE, major vascular event; OCT, optimal combination drug treatment; BMI, body mass index.

Kaplan-Meier curves for the endpoint of major vascular events in the lean (A), overweight (B), and obese groups (C) over 2 years after an ischemic stroke based on secondary prevention medication class (level 0/I to III). An optimal combination drug treatment of level III was shown to diminish the risk of MVEs in the lean and overweight stroke patients. MVE, major vascular event.
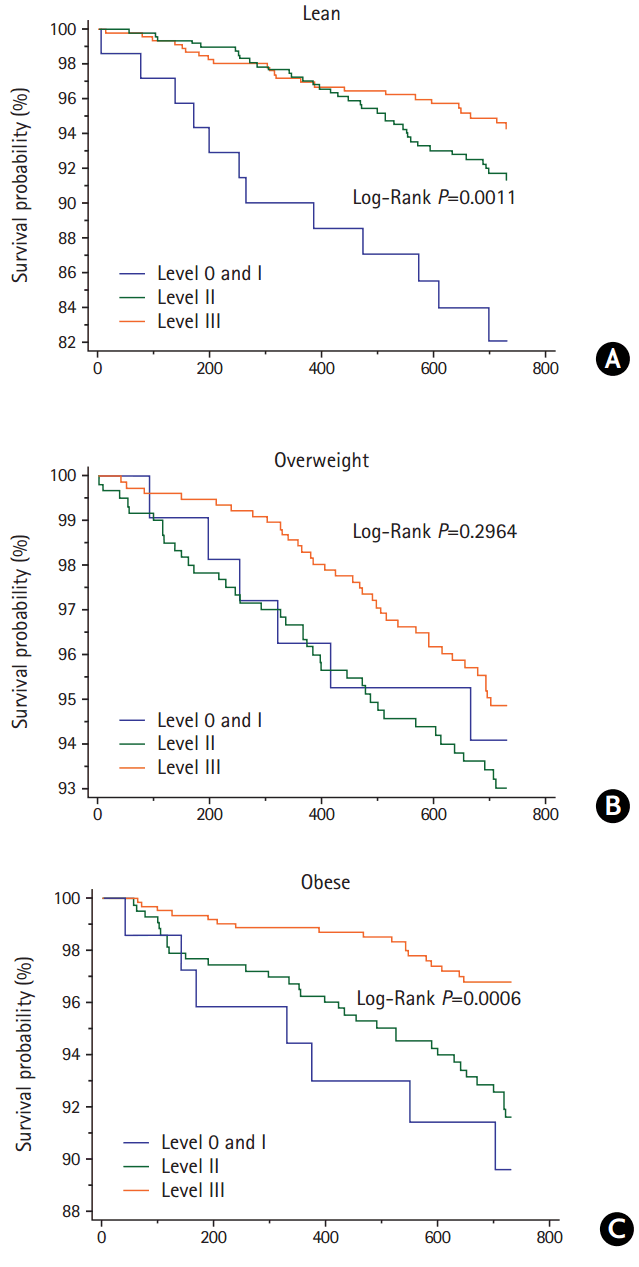
Kaplan-Meier curves for the endpoint of all-cause death in the lean (A), overweight (B), and obese groups (C) over 2 years after an ischemic stroke based on secondary prevention medication class (level 0/I to III). An optimal combination drug treatment of level III was shown to diminish the risk of death in the lean and obese stroke patients.
Discussion
In this analysis of >3,600 subjects with recent ischemic stroke, we observed that approximately 28% of study subjects were lean at baseline, and among these lean patients, use of OCT for secondary prevention was less frequent (vs. overweight and obese subjects); however, when an OCT was implemented, it was associated with significantly better clinical outcomes for these patients over a 2-year follow-up period.
As previously noted, one explanation for the so-called obesity paradox is that obese stroke patients display a readily identifiable high cardiovascular risk phenotype that may lead to them receiving or seeking earlier/more aggressive treatment. Indeed, our study showed that obese patients had more diagnosed medical comorbidities, were taking more individual medications, and had a greater rate of OCT as compared to lean patients.
The risk reduction of MVEs/all-cause death in patients who were on OCT was more likely to be higher (52%/77%) in the lean group than in the overweight (46%/39%) and obese (36%/68%) groups. However, in contrast to the findings of a prior study [3], we did not find a statistically significant obesity paradox for MVEs in the VISP cohort. Furthermore, while an obesity paradox was observed in terms of the outcome of death, its significance disappeared after multivariable adjustment.
As shown in Supplementary Tables 3–5, the factors associated with death in lean patients were diabetes, history of CHD, and elevated creatinine levels (i.e., chronic renal disease), whereas among obese patients, HF was a predictor of death. RAS modulators are preferentially recommended in the management of patients with diabetes, CHD, and chronic renal disease [14]. RAS modulator (i.e., benazepril)+CCB (i.e., amlodipine) combination therapy was beneficial in reducing cardiovascular events in high-risk patients with hypertension [15]. In a recent meta-analysis, RAS modulator+CCB combination therapy (vs. other combination therapies) was associated with a greater clinical benefit in terms of cardiovascular outcome and preservation of renal function [16]. During the VISP trial, the use of RAS modulator+CCB combination therapy was not high. Among 2,959 patients who were taking AH medications, 651 (22.0%) received RAS modulator+CCB combination therapy. The proportion was even lower (18.1%) in lean stroke patients.
It should be pointed out that a history of HF was linked to an increased risk of death or/and MVEs in the overweight and obese patients. Absolute mortality rates for HF are high (~50%) [17,18]. We speculate that this might have been due to the relatively lower rate of RAS modulator+BB therapy among the overweight and among obese patients (14.9% and 15.8%, respectively). This combination of AH therapy is the fundamental treatment strategy for HF (Class I, Level of evidence A) [19].
Taking all of this into account, it is conceivable that the beneficial effect of RAS modulator+CCB combination therapy on the lean stroke patients and the low proportion of prescribed RAS modulator+BB therapy in the overweight/obese stroke survivors might have attenuated the power of the obesity paradox.
Other possible factors that may have obscured the obesity paradox in terms of MVEs in the VISP cohort could be the baseline differences in the VISP population and the other study’s population including the size of the latter, which comprised over 20,000 patients, as well as medication prescription patterns [3].
This study has some limitations. First, the VISP trial was conducted over a decade ago. However, baseline risk factor profiles and background treatments were comparable to more contemporary large, noncardioembolic stroke secondary prevention trials [20] and we conducted multivariable analyses to adjust for confounders. Second, this is a post hoc analysis of a completed randomized trial that comprised an overwhelming majority of whites (85%). Therefore, our results should be seen as hypothesis-generating and may not be generalizable to the broader population. Third, atrial fibrillation is a robust contributor to cardioembolic stroke and its prevalence increases with age [21,22]. Cardioembolic stroke by atrial fibrillation is associated with mortality and higher risk of recurrent stroke [22]. Since VISP was based on noncardioembolic strokes, our results warrant being rigorously validated in a prospective study design that includes cardioembolic stroke. Fourth, this study was conducted on the basis of recorded VISP data regarding medication use, but not regarding medical behavior, drug adherence, or socioeconomic status reflecting attention to health care because of the nonavailability of such information, which otherwise might have influenced the current results. Finally, BMI measurement does not effectively reflect body fat composition as well as abdominal circumference or waist-hip ratio, but it is a highly practical and established way of approximating body fat composition. Despite the aforementioned limitations, the study was strengthened by the rigorous study procedures of VISP and a fairly large sample size.
Conclusions
This study found that lean patients with a recent stroke showed a pattern of numerically higher rates of MVEs and death, but were less likely to receive OCT compared to their obese counterparts. We also observed that OCT in lean recent stroke patients was related to a significantly lower risk of future MVEs and all-cause death, but that it did not significantly impact the occurrence of death in overweight patients or MVEs in obese patients. Given these results, it is conceivable that the obesity paradox may in part be explained by the implementation of a more aggressive secondary prevention treatment in obese stroke patients, given their more readily identifiable high cardiovascular risk phenotype (vs. lean patients). However, this inference is an indirect one and our study did not consider other important factors such as medical behavior, drug adherence, and life-style modifications. Our results need to be reproduced and confirmed by future studies.
Supplementary Materials
Supplementary materials related to this article can be found online at (https://doi.org/10.5853/jos.2016.01347).
Antihypertensive medication classes among the 3643 study subjects
Frequencies of each antihypertensive (AH) drug class according to body mass index (BMI) category
Adjusted hazard ratios (AHRs) of covariates included in the multivariable Cox model of vascular outcomes and death in individuals with lean body mass index (BMI)
Adjusted hazard ratios (AHRs) of covariates included in the multivariable Cox model of vascular outcomes and death in individuals with overweight body mass index (BMI)
Adjusted hazard ratios (AHRs) of covariates included in the multivariable Cox model of vascular outcomes and death in individuals with obese body mass index (BMI)
Univariate and multivariate risk-adjusted effect of secondary prevention medication classes (Level 0 to III) on the risk of ischemic stroke by body mass index (BMI) categories at 2 years follow-up
Comparison of event rates (%) of major vascular events and all-cause death in patients across body mass index categories according to secondary prevention medication class (level 0-I to III). Lean was defined as body mass index (BMI) <25 kg/m2 ; overweight, BMI 25 to 29.9 kg/m2 ; and obese, BMI ≥30 kg/m2.P by χ2 test.
Notes
The authors have no financial conflicts of interest.
