Stroke Epidemiology in South, East, and South-East Asia: A Review
Article information
Abstract
Asia, which holds 60% of the world’s population, comprises some developing countries which are in economic transition. This paper reviews the epidemiology of stroke in South, East and South-East Asia. Data on the epidemiology of stroke in South, East, and South-East Asia were derived from the Global Burden of Disease study (mortality, disability-adjusted life-years [DALYs] lost because of stroke), World Health Organization (vascular risk factors in the community), and publications in PubMed (incidence, prevalence, subtypes, vascular risk factors among hospitalized stroke patients). Age- and sex-standardized mortality is the lowest in Japan, and highest in Mongolia. Community-based incidence data of only a few countries are available, with the lowest rates being observed in Malaysia, and the highest in Japan and Taiwan. The availability of prevalence data is higher than incidence data, but different study methods were used for case-finding, with different age bands. For DALYs, Japan has the lowest rates, and Mongolia the highest. For community, a high prevalence of hypertension is seen in Mongolia and Pakistan; diabetes mellitus in Papua New Guinea, Pakistan, and Mongolia; hypercholesterolemia in Japan, Singapore, and Brunei; inactivity in Malaysia; obesity in Brunei, Papua New Guinea, and Mongolia; tobacco smoking in Indonesia. Hypertension is the most frequent risk factor, followed by diabetes mellitus and smoking. Ischemic stroke occurs more frequently than hemorrhagic stroke, and subarachnoid hemorrhages are uncommon. There are variations in the stroke epidemiology between countries in South, East, and South-East Asia. Further research on stroke burden is required.
Introduction
Stroke is a major cause of death and disability in many countries. It was reported that, in 2013, globally, there were nearly 25.7 million stroke survivors, 6.5 million deaths due to stroke, 113 million disability-adjusted life-years (DALYs) lost because of stroke, and 10.3 million new cases of strokes [1]. A majority of the stroke burden was observed in developing countries, accounting for 75.2% of all stroke-related deaths and 81.0% of the associated DALYs lost.
Stroke is an especially serious problem in Asia, which has more than 60% of the world’s population, and many of its countries are “developing” economies. Stroke mortality is higher in Asia than in Western Europe, the Americas or Australasia, except in the case of some countries such as Japan [2]. The epidemiology of stroke in East Asia and South Asia has been previously reviewed [3,4]. A recent review of stroke in 12 Asian countries included 3 of the 11 countries in South-East Asia [5], whose people largely have South and East Asian origins—however, data on the remaining South-East Asian countries were not presented.
This study was conducted to review the recent epidemiology of stroke in South, East, and South-East Asia, including mortality, incidence, prevalence, DALYs lost, stroke subtypes and risk factors, based on data from the Global Burden of Disease (GBD) study, World Health Organization (WHO), and recent major publications from Asian countries. A greater understanding of the stroke burden in this part of the world could assist in the appreciation of the magnitude of stroke and its diversity, and help in healthcare planning and resource allocation.
Methods
A search was conducted of all the publications in the PubMed database, from the time of entry into the database to November 1, 2015. The search terms used were “stroke” with the operator “and”, along with any (“or”) of the following terms: “burden”, “epidemiology”, “mortality”, “incidence”, “prevalence”, “subtype”, and “risk factors”. The operator “and” was then used with the name of each country in South, East, and South-East Asia. Data from Middle-Eastern countries were excluded, as the people from those countries are ethnically different from those in the other parts of Asia. The abstracts were reviewed for relevance, and data on stroke epidemiology were extracted. Where possible, the original papers were also obtained and reviewed. The most recent studies or review papers from each country, were preferred over older publications. Data on incidence and prevalence were obtained from community-based studies with wide age ranges and no upper limit. Data on the stroke subtypes and vascular risk factors among stroke patients were preferably from multi-center hospital collaborations with high brain scan rates. There was no exclusion based on language. Data on stroke mortality and morbidity were obtained from the GBD study, and vascular risk factors in the community were obtained from the WHO database. All the data search was conducted by a single author (NV). The data were then tabulated, stratified according to geographical regions.
Results and discussion
Mortality
As per the GBD study, the age- and sex-standardized mortality in Asia has a wide range (Table 1) [2]. The lowest rates are observed in Japan (43.4/1,000,000 person-years and Singapore (47.9/100,000 person-years), followed by Bangladesh, Papua New Guinea, and Bhutan. The highest rates are observed in Mongolia (222.6/100,000 person-years) and Indonesia (193.3/100,000 person-years), followed by Myanmar and North Korea. All three regions show a range of mortality values, although, in general, they are lower in South Asia and high-income countries in East Asia. These varying rates may reflect the differences in stroke incidence, disease severity, and quality of healthcare. Competing causes of death such as coronary artery disease may provide a falsely low mortality value attributable to stroke.
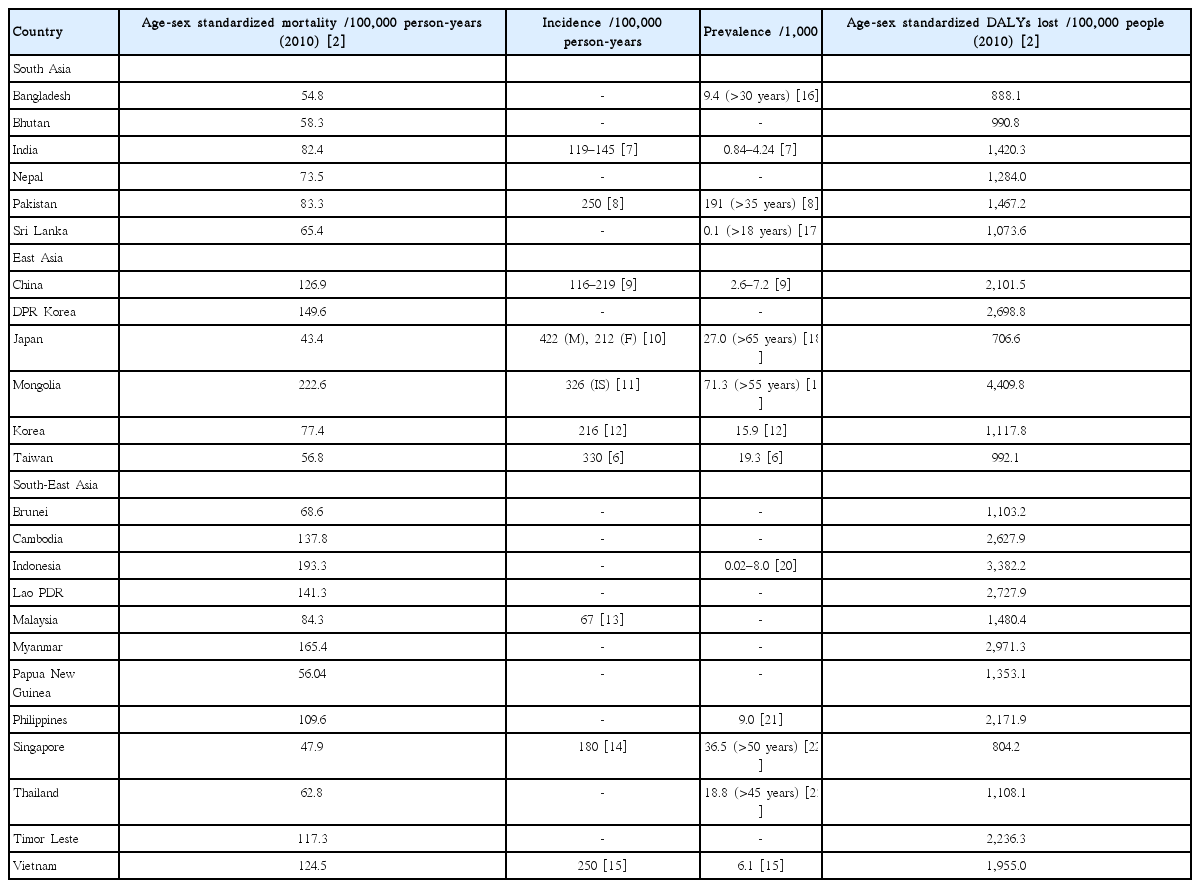
Mortality, incidence, prevalence, and DALYs lost because of stroke
Incidence
Stroke incidence data are available for most countries in East Asia, but only for some in the other regions (Table 1) [6-15]. The lowest rate is observed in Malaysia (67/100,000 person-years). The highest rates are in Japan (422/100,000 person-years among men and 212/100,000 person-years among women) and Taiwan (330/100,000 person-years). However, the results are not strictly comparable, as the methods used were variable and the studies were performed at different time points. However, the observed variations may reflect differences in the risk-factor prevalence, screening/detection method and level of control.
Prevalence
Data on stroke prevalence are more readily-available than those on incidence; especially so in East Asia (Table 1) [6-9,12,15-23]. Comparisons of the studies are difficult to perform as differing study methods were used for case-finding, and differing age bands were investigated. These studies were also conducted at different time points. As prevalence reflects the balance between incidence and mortality, a low prevalence may be due to low incidence or high mortality or both; conversely, a high prevalence may be due to high incidence or low mortality or both. Competing illnesses such as coronary artery disease may reduce the number of stroke survivors and provide a falsely low stroke prevalence value. Prevalence still, however, reflects the status of disease in the community that healthcare services for chronic diseases need to actively deal with.
Stroke burden
Arguably, the best measure of stroke burden is the number of DALYs lost because of stroke. Based on data from the GBD study, there was a wide range of age- and sex-standardized stroke DALYs lost in Asia, in 2010 (Table 1) [2]. The lowest rates are in Japan (706.6 /100,000 people) and Singapore (804.2/100,000 people), with low rates also observed in Bangladesh and Bhutan. The highest rates are in Mongolia (4,409.8/100,000 people) and Indonesia (3,382.2/100,000 people), with high rates also observed in Myanmar, Lao PDR, North Korea, and Cambodia. As in the case of mortality, a range of the rates of DALYs lost are observed in all three regions, but the DALYs lost tend to be lower in high-income countries in East and South-East Asia. The DALYs lost reflect the net effects of mortality, incidence, and disability among prevalent cases, and the latter possibly indicates the effects of stroke severity and rehabilitative services.
Vascular factors
Increasing age, sex (male), and genetics are non-modifiable risk factors for stroke. The modifiable stroke risk factors are shown in Table 2, based on data from the WHO [6,24]. These were derived from community-based cross-sectional surveys. Similar criteria were used for diagnosis, which makes the studies comparable.
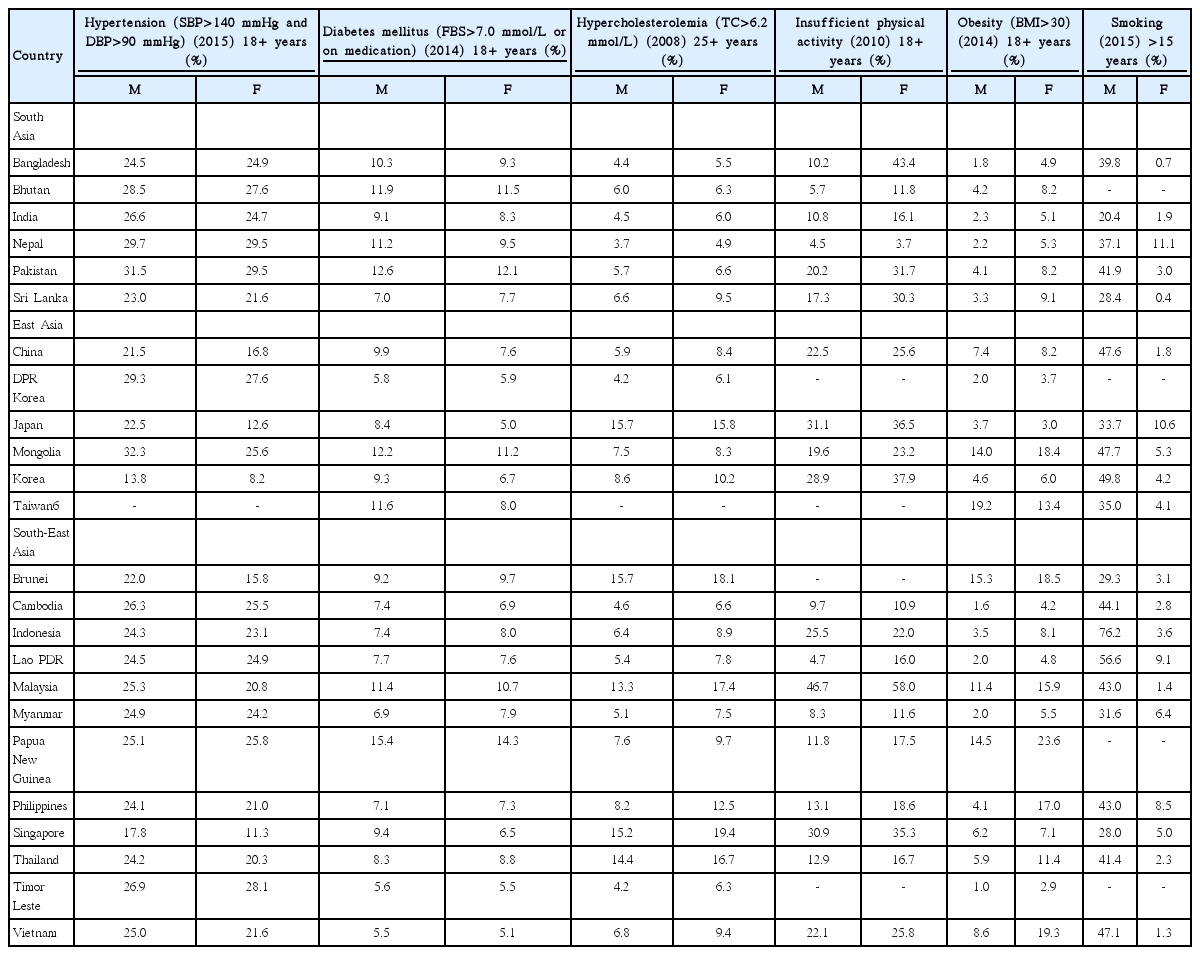
Vascular risk factors in the community
Hypertension remains the most common medical risk factor for stroke, whereas current smoking and inactivity are the most predominant among lifestyle-related risk factors. In most countries, high or low frequencies of occurrence are observed consistently across all risk factors for that country, compared to other countries. There is a range of frequencies within each region. A high prevalence of hypertension is seen in Mongolia and Pakistan (low in Korea and Singapore); diabetes mellitus in Papua New Guinea, Pakistan, and Mongolia (low in Vietnam, Timor Leste, and DPR Korea); hypercholesterolemia in Japan, Singapore and Brunei (low in Nepal, Timor Leste, and DPR Korea); inactivity in Malaysia (low in Nepal and Lao PDR); obesity in Brunei, Papua New Guinea, and Mongolia (low in Timor Leste, Cambodia, and Bangladesh); tobacco smoking in Indonesia (low in India). In general, hypertension, diabetes mellitus and tobacco smoking tend to be more prevalent among men, whereas hypercholesterolemia, inactivity and obesity tend to be more prevalent among women.
Data on the vascular risk factors among stroke patients are available for a number of countries (Table 3). These are derived from hospital-based stroke registries [6,12,25-36]. They are not strictly comparable as varying definitions were used, and studies were performed at differing time points, but there is still some consistency in the findings. Hypertension is the most common risk factor, with diabetes mellitus and smoking following closely. A significant proportion of stroke patients have had previous cerebrovascular events and coronary artery disease.
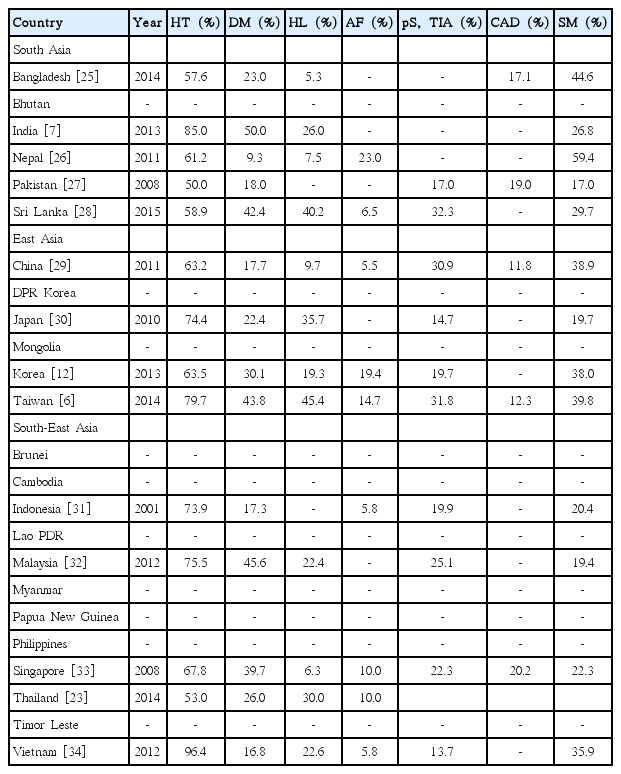
Vascular risk factors among stroke patients, from hospital-based registries
Possessing knowledge on the risk factors in each population can inform policy makers and healthcare planners on which factors should be targeted and what appropriate preventive measures should be taken.
Stroke subtypes
Information on stroke subtypes is also available in most countries, as derived from hospital-based stroke registries (Table 4) [6,12,23,25-27,29,31-40]. In general, ischemic stroke occurs more commonly than hemorrhagic stroke, except in India and Vietnam, where the converse is observed. Subarachnoid hemorrhage is uncommon. Cerebral venous sinus thrombosis may also cause stroke, especially among young women [4,6].

Stroke subtypes from hospital-based registries
Geographical variations within countries
Variations in stroke epidemiology have been found within many countries. Studies in China have shown that the stroke incidence is higher in the northern regions compared to the south [9], with double the incidence along the stroke belt [41]. In India, on the contrary, the incidence is higher in rural areas [7]. In Thailand, the stroke prevalence is highest in the cities, and then, in a decreasing fashion, in the central, south, north, and northeast regions of the country [23]. Similarly, stroke prevalence was found to be higher in cities and urban areas than in rural regions, in Indonesia [20]. These differences have been attributed to the differences in the risk factors between various regions in the same country. However, there is no difference in the age-standardized stroke mortality between the metropolitan cities of Korea and the other regions in the country [12].
Comparative epidemiology
Heart disease and stroke are competing causes of mortality. Generally, stroke-associated mortality, as a percent of total mortality, is lower than ischemic heart disease-related mortality, in most parts of the world [42]. This has been attributed to the higher prevalence of diabetes mellitus and higher mean serum cholesterol levels among those with ischemic heart disease, than stroke patients. However, in some countries, the converse is true, wherein the stroke-related mortality exceeds the mortality caused by ischemic heart disease (in China by 11.9%, Korea by 9.9%, Mongolia by 8.0%, Thailand by 6.6%, etc.). Yet, the stroke mortality in Asia is higher than in North America or Europe [43].
Likewise, globally, the disease burden—as measured by the DALYs lost—associated with stroke is lower than that associated with ischemic heart disease [42]. However, in terms of mortality, the stroke burden exceeds the ischemic heart disease burden in the same countries in which an excess stroke mortality is observed—China, Mongolia, and Thailand.
As in much of the world, ischemic stroke occurs more frequently than hemorrhagic stroke (Table 4). However, the 15–40% incidence of stroke due to hemorrhage, in Asia, is much higher than the 15% observed in most developed countries in North America and Western Europe. The incidence of hemorrhagic stroke is highest in East Asia, notably in China, compared to North America and Western Europe [44].
Trends
Globally, between 1990 and 2013, there was a rise in the number of deaths, survivors, and events associated with stroke. However, the significant increase in the associated deaths and DALYs lost were not significantly different between developing and developed countries [1].
Stroke-related mortality has been decreasing in East-Asian countries such as Japan, Korea, Taiwan, and the urbanized areas of China [43]. This may be due to the better risk factor control and stroke care in these countries. However, the age-standardized stroke incidence, in general, has remained relatively constant. The GDB study showed a reduction in age-standardized stroke incidence in Japan, Singapore, and Korea, between 1990 and 2010 [2]; in fact, the substantial decline in the age-adjusted stroke incidence in Japan began in the 1960s, due to a decrease in severe hypertension and current smoking [45]. Impressive falls in the DALYs lost were observed in Japan, Singapore, Korea, and Taiwan (Table 5) [2]. The decrease in high mortality, incidence and morbidity, observed predominantly in high-income countries, reflects the significant impact of the economic status of a country on health. This pattern of high incidence and falling mortality is likely to raise the prevalence of stroke in those countries. This problem may be compounded by the presence of fewer caregivers, as these countries also have low birth rates.
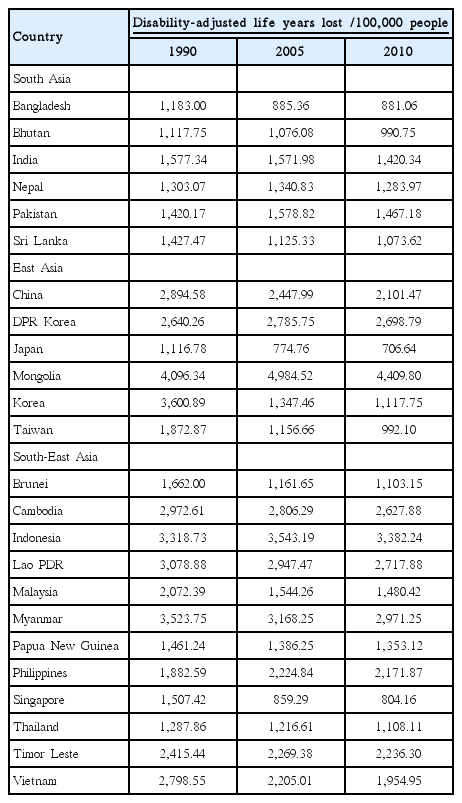
Age and sex-standardized disability-adjusted life years lost, 1990.2010
In South-Asian counties such as India, Pakistan, and Bangladesh, and in developing countries in South-East Asia, such as Cambodia, Indonesia, Lao PDR, and Malaysia, with the better control of infectious diseases, life expectancy will be prolonged. With the economic transition of these countries, towards achieving “developed country” status, risk factors such as hypertension, diabetes mellitus, hypercholesterolemia, obesity, and cigarette smoking will become more prevalent, raising the incidence of stroke. However, due to insufficient healthcare facilities in these developing countries, the mortality will be high, and the number of disabled survivors will also rise.
Limitations and strengths
Our study has several limitations. The data from the WHO, though comprehensive and available for almost all countries, are based on routinely available data in those countries. There may be variations in the comprehensiveness of the data collection and data reporting, accuracy of the cause of death, and extent of disability. Prevalence and incidence studies, though community-based, were performed at different time points, involved varying ages (especially prevalence studies), used differing methods to screen and assess cases, and thus are not directly comparable. The data were not granular enough to allow for a systematic review. Data were unavailable for a number of countries. Hospital-based studies are prone to selection bias, with a significant flaw in their representativeness; they were performed at different time points; they used varying definitions for the risk factors; and few had 100% brain scan rates. Nation-wide data with good representativeness would be preferred—at present, such data are only available from the country—wide hospital-based registry in China [29].
However, our paper has several strengths. It includes up-to-date reliable data from the excellently-performed GBD study and WHO, as well as large, recently-conducted studies from most Asian countries. Data on South-East Asia are available, alongside data on South and East Asia. The paper summarizes and compares, in an easily readable manner, key epidemiological data on stroke that could be helpful to clinicians, researchers and healthcare planners.
Conclusions
Stroke is a major healthcare problem in South, East, and South-East Asia. With a majority of the world’s population living in the developing countries of these regions, the the global burden of stroke will have the largest contribution from Asia. In these countries, there are disparities in the healthcare provisions, and this will continue to pose a challenge to disease control. Governments and healthcare workers need to work together, with an informed public, to stem this growing epidemic. As life expectancy increases, with the aging of Asian populations and reduction in mortality due to infectious diseases, and the rise in the prevalence of vascular risk factors among economies in transition, the stroke burden in Asia will surely rise.
Notes
The authors have no financial conflicts of interest