The Incidence of Perioperative Stroke: Estimate Using State and National Databases and Systematic Review
Article information
Abstract
Background and Purpose
Perioperative stroke remains a devastating complication after surgical procedures, due to hemodynamic and inflammatory changes that increase the risk of strokes within 30 days following surgery. We aimed to assess the incidence of perioperative strokes in patients undergoing various surgical procedures and reach a national estimate.
Methods
A retrospective cohort study was conducted using California State Inpatient Databases, State Emergency Department Databases, State Ambulatory Surgery and Services Databases, and the National Inpatient Sample (NIS) during the period 2008 to 2011 from the Healthcare Cost and Utilization Project. A systematic review was conducted using PubMed, Embase, and Web of Science databases to obtain published articles that reported the incidence of perioperative stroke in various surgical procedures.
Results
Analysis of 3,694,410 surgical encounters from the state of California (mean±standard deviation age: 52.4±21.1 years) yielded an overall rate of perioperative stroke of 0.32% (n=11,759). The incidence of perioperative strokes was highest following neurological (1.25%), vascular (1.07%), and cardiac (0.98%) surgeries. The NIS database contained a total of 48,672,974 weighted hospitalizations and yielded a rate of perioperative stroke of 0.42% (n=204,549). The systematic review completed yielded 187 articles, which had an overall sample size of 184,922 and an incidence of perioperative stroke ranging from 0% to 13.86%. It is estimated that in any given year, there would be approximately 40,000 to 55,000 (0.33% to 0.46%) perioperative strokes nationally.
Conclusions
Our findings support further strategies to identify and stratify patients undergoing surgical procedures with a high incidence of perioperative strokes to improve patient counseling and a future potential treatment plan.
Introduction
Perioperative stroke, a new neurological deficit that occurs during or within 30 days of surgery [1], is a devastating complication because it is associated with significant clinical burden and mortality [1-3]. The vast majority of these strokes are ischemic, and about 1% to 4% are hemorrhagic [2,4,5]. The majority of the strokes (50%) occur within the first postoperative day [3,6].
The incidence of perioperative stroke varies among different types of surgical procedures, as it ranges approximately from 1.9% to 9.7% in high-risk cardiovascular surgeries, e.g., coronary artery bypass grafting (CABG) surgeries have a perioperative stroke rate of 3% to 5% [7] compared to 0.1% to 1.9% in non-cardiovascular, non-neurological and minor vascular surgeries [1,3,8]. This variation in incidence is attributed to the surgical procedure itself as well as the associated risk factors and comorbidities [2]. The incidence of perioperative stroke has not changed over the past two decades despite an improvement in medical and surgical care [2,9].
The primary objective of the present study was to estimate the national incidence of perioperative strokes in patients undergoing various surgical procedures. We achieved this objective through analysis of a state-wide database and stratifying included patients according to their comorbidities and demographic variables, including age, sex, and ethnicity. We further estimated the incidence of perioperative stroke with results from the National Inpatient Sample (NIS) database. Finally, we performed a systematic review for all published studies reporting the incidence of perioperative stroke following various surgical procedures; this review has helped to solidify the calculated estimate we have reached using our databases. We expect the results of the study to improve the recognition and diagnosis of perioperative stroke and patient safety, which will help us estimate the financial cost and burden of perioperative stroke, as well as, pave the road for optimizing therapeutic and preventive measures that could be implemented to minimize the incidence of perioperative stroke.
Methods
Data source
Informed consent was not required by the The Institutional Review Board (IRB) at our institution for this retrospectic cohory analysis. Data were obtained from the Healthcare Cost and Utilization Project (HCUP) including State Inpatient Databases (SID), State Emergency Department Databases (SEDD), and State Ambulatory Surgery and Services Databases (SASD) for the state of California, and NIS during the 2008 to 2011 period. The SID, SEDD, and SASD contain the universe of the inpatient, emergency department (ED) and outpatient unit discharge abstracts and a set of clinical and nonclinical information on about 97% of patients discharged from different medical facilities in California. We chose the California state databases as they contain present on admission (POA) indicator; which is defined as the conditions present when the inpatient admission occurs [10]. The POA indicator helps to differentiate strokes occurring in patients as a complication following surgery from those presented on admission with a stroke or history of stroke. The NIS contains data from all-payer inpatient health care in the United States, yielding national estimates of hospital inpatient stays.
Patient and surgical procedure selection
Patients in this study were those who underwent any surgical procedure from 2008 to 2011; this period was chosen because 2008 was one of the first years where the SID adopted using the POA indicators. The years 2010 and 2011 were chosen in Table 1 because claims databases tend to be very granular and improve yearly; therefore, presenting the most 2 recent years seemed most suited. Most patients undergoing any surgical procedure that did not require intubation and general anesthesia were excluded. Patients were identified according to their primary diagnosis, surgical procedure and comorbid risk factors using the International Classification of Diseases, 9th Revision, Clinical Modification (ICD-9-CM) and the Clinical Classification Software (CCS) which is a uniform and standardized coding system, that collapses the vast multitude of codes found in the ICD-9 into a smaller number of clinically meaningful categories.

The incidence of perioperative stroke during 2010 to 2011 for both genders according to different age groups and races
Each specific surgical subcategory in Table 2 reflects one ICD-9 code for one or more surgical procedure and intervention, the specific surgical procedure(s) for each subcategory are shown in Supplementary Table 1. The ICD-9 codes for the five subcategories were selected according to the combined highest procedure frequency, stroke number, and stroke incidence. Supplementary Tables 2-4 show the highest 100 surgical subcategories according to procedure frequency, stroke number, and stroke incidence respectively. Any results showing single digit number of cases were replaced by “*” to maintain patient privacy.

The incidence of perioperative stroke for the state of California in different surgical categories
Covariates
The patients were identified into different categories according to hospital-level covariables, including age, sex, ethnicity, and specific comorbidities. Surgical procedures were stratified into 15 surgical categories according to the system involved. The age sub-groups were separated starting from 0 to 17 years, and from 18 to 25 years and every 5 years after that. Patients who suffered from perioperative stroke were identified according to the presence of at least one ICD-9 codes shown in Supplementary Table 5.
Outcomes
The primary outcome of the present study is strokes that occurred within 30 days of surgical procedures that require intubation and general anesthesia.
Systematic review
A systematic review was conducted on the incidence of perioperative stroke after surgical procedures. It complied with the Preferred Reporting Items for Systematic Reviews and Meta-Analyses (PRISMA). The search criteria, inclusion and exclusion criteria, detailed data extraction information, and PRISMA flowchart, are found in Supplementary Material, Supplementary Table 6, and Supplementary Figure 1.
PubMed, EMBASE, and Web of Science were used as the search databases for relevant literature. Two researchers (R.A. and E.J.) independently conducted the study search, and a third researcher (K.A.) settled any disagreements.
Statistical analysis
Dataset construction and analysis were done using the SAS program version 9.4 (SAS Institute Inc., Cary, NC, USA). Data in each year from 2008 to 2011 were merged into a shared database. Patient records were linked and tracked using VisitLink and DaysToEvents variables provided by HCUP. For patients with multiple admissions and surgeries, only the first record was considered for analysis. The cases that were lacking values for age, gender, and race were not excluded in our final dataset as they composed a sizable portion of the data. Descriptive data characteristics were presented as mean±standard deviation or as a number of cases with their percentages.
CCS codes available on the HCUP website were used to group surgical procedures into different categories. ICD-9 procedural codes were used for surgical subgroup analysis. We created an array that searches through every record’s diagnoses variable 2 to 25 with negative POA variable. The negative POA variable helps us differentiate between cases of stroke developing during the inpatient hospital stay and cases of stroke that was present at the time of admission, and therefore, eliminating the latter. We performed univariate analyses using an unpaired t-test for continuous variables and Pearson’s chisquare test for categorical variables.
The HCUP uses databases as samples used to represent a larger universe. To generate a national estimate using the NIS database, a process called data weighting must be performed on the discharge or hospital weights from unweighted counts [11], which was performed and stratified using the strata variable provided by HCUP. NIS databases do not contain the POA variable, which made it impossible to identify cases of stroke that happened before the studied surgical admission.
Results
Patient characteristics
California state database
A total of 3,694,410 patients who underwent various surgical procedures during 2008 to 2011 were identified from the SID, SASD, and SEDD. In the present dataset, 63.21% of the cases were females (n=2,267,321) with cases missing values for gender (n=107,537, 2.91%), the largest age and racial groups were those between 61 to 65 years of age 8.21% (n=300,779) and white 58.44% (n=1,991,270) with cases missing values for age (n=31,294, 0.85%) and race (n=287,191, 7.77%).
Patients who suffered from a perioperative stroke were older (67.6±16.7 years vs. 52.4±21.1 years) and more likely to be females (50.9%, P<0.01). However, the incidence of perioperative stroke was higher in males (0.44% vs. 0.26%) because of the high number of obstetrics and gynecology (OBGYN) surgeries that had a low total incidence of perioperative stroke (Table 2). The most prevalent comorbidities in patients from this dataset were hypertension (n=1,445,794, 39.13%), iron deficiency anemia (n=571,964, 15.48%), and uncomplicated diabetes (n=457,844, 12.39%).
NIS database
From the NIS database, a total of 48,672,974 weighted hospitalizations were obtained during 2008 to 2011, 58.0% of the cases were females (n=27,984,592), and the largest age and racial groups were those between 0 to 17 years of age 11.71% (n=5,701,621) and white 69.1% (n=28,643,738), while cases missing values for race comprised a proportion of the cohort, we were not able to obtain the number of those missing cases after data weighting. The patients who suffered from a perioperative stroke were older (65.1±17.5 years vs. 47.4±24.9 years), and the incidence of perioperative stroke was higher in males (0.43% vs. 0.31%).
Systematic review
The systematic review performed, without a meta-analysis, yielded 187 papers, with a total cohort of 184,922 patients. The highest three countries that had the most published papers in our search were United State (58 papers, 75,456 patients), Italy (23 papers, 15,703 patients), and Germany (21 papers, 11,814 patients). From the 58 papers published in the United States, there were 57 papers on cardiovascular procedures and one paper on noncardiovascular procedures.
Incidence of perioperative stroke
California state database results
The 30-day stroke incidence was 0.32% (n=11,759) in all surgical procedures in this database. The majority of patients suffered from perioperative stroke during the same surgical hospitalization (86.38%, n=10,157), while the rest (13.62%, n =1,602) occurred as a readmission within the 30-day postoperative period after discharge, or as a visit to the ED or as a visit to an observation unit in an outpatient setting.
The incidence of perioperative stroke in the state of California during 2010 to 2011 for each gender according to different age groups and races, as well as the overall incidence through 2008 to 2011 for age and race using the dataset for the state of California and the NIS are shown in Table 1. For incidence calculation and comparison between the two genders in Table 1, OBGYN and male reproductive surgeries were excluded, resulting in 2,537,251 patients in 2008 to 2011. The incidence of perioperative stroke rises significantly after the age of 40 in both genders (Table 1). However, the incidence was markedly higher in patients younger than 17 years old—compared to the following older age groups—in both genders in 2010 to 2011 with an incidence of 0.15% (n=196) in that age group. Among race groups, perioperative stroke was highest among Asian and Pacific Islander in both genders in 2010 to 2011 with an incidence of 0.45% (n=1,181).
Surgical procedures with the highest incidence of perioperative strokes in the state of California for different age groups during 2008 to 2011 are shown in Figure 1. It shows that neurosurgical and cardiac procedures have the highest perioperative stroke incidence in age groups between 65 to 95 years old, neurosurgery peaking at 2.19% in the age group of 86 to 90 years and cardiac surgery peaking at 2.5% in the age group of 91 to 95 years. Meanwhile, organ transplant procedures were the highest in almost all age groups younger than 65 years, peaking at 4.17% in the age group of 36 to 40 years. The incidence of perioperative stroke in all surgical procedures peaked at 0.82% in the age group of 86 to 90 years, while it had an apparent increase starting at the age of 40.
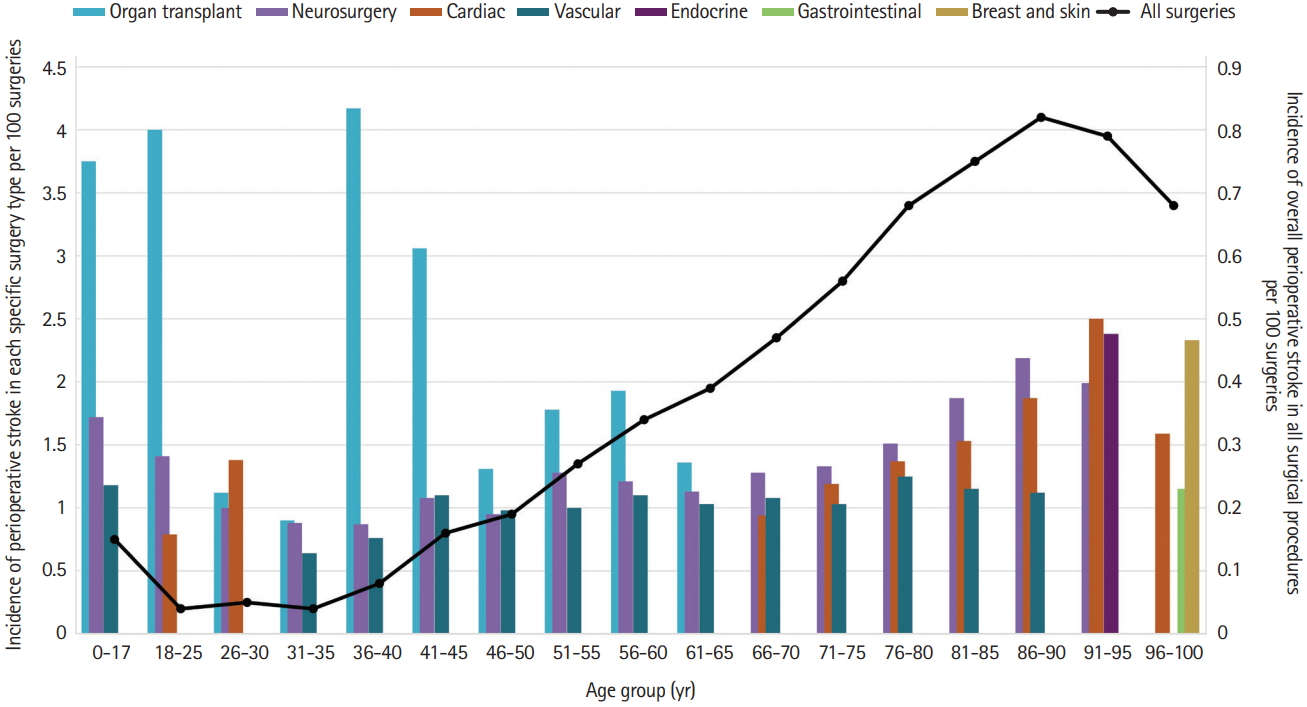
The overall Incidence of perioperative stroke according to different age groups and the highest three surgical categories in each age group.
The incidence of perioperative stroke in the state of California during 2010 to 2011 according to the surgical procedure for each gender, as well as the overall incidence during 2008 to 2011, are shown in Table 2. The surgical categories with the highest overall incidence of perioperative stroke were organ transplant surgeries 1.9% (n=74) followed by neurosurgeries 1.25% (n=1,594) and vascular surgeries 1.07% (n=3,170).
The incidence of perioperative stroke in patients with different comorbidities in the state of California during 2008 to 2011, as well as the prevalence of those comorbidities in patients who suffered from a perioperative stroke, are shown in Figure 2. Correlation between the number of comorbidities and the incidence of perioperative stroke is shown in Figure 2A, as patients who had increasing numbers of comorbidities, had a higher incidence of perioperative stroke. It also shows that 56.5% of patients who suffered from perioperative stroke had one comorbidity or less. Specific comorbidities shown in Figure 2B, demonstrate that patients who had paralysis or other neurologic disorders had the highest incidence of perioperative stroke that ranges between 5.18% to 5.81% and 1.64% to 1.84% respectively. It also shows that hypertension (68.03%, n=8,000), fluid and electrolyte disorders (39.10%, n=4,598), and paralysis (29.08%, n=3,419) were the most prevalent comorbidities in patients who suffered from a perioperative stroke.

Associated comorbidities in patients who suffered from a perioperative stroke in the state of California during 2008 to 2011. (A) The association between the number of comorbidities and the incidence of perioperative stroke, as well as the prevalence of the count of comorbidities in patients who suffered from a perioperative stroke. (B) The incidence of perioperative stroke with different comorbidities and the prevalence of those comorbidities in patients who suffered from a perioperative stroke.
NIS database results
The overall incidence of inpatient perioperative stroke from the NIS is 0.42% (n=204,549), results from the NIS in Table 1 shows a similar pattern to the California state database with slightly higher incidences in age groups older than 40. However, the youngest age group (0 to 17 years) did not show a significantly higher perioperative stroke incidence compared to the older age groups.
Systematic review
From our systematic review, 187 articles were qualified for data extraction and yielded an overall cohort sample size of 184,922 as shown in Table 3, detailed information about the search results can be found in Supplementary Material and Supplementary Table 6.

Characteristics of systematic review results according to surgical procedure type
Studies that provided information about perioperative strokes occurring in cardiovascular and non-cardiovascular procedures, comprised a cohort of 145,714 and 39,208 patients and the perioperative stroke incidence and stroke number ranged from 0% to 13.86% (n=0–214; total=2,342) and 0% to 1.05% (n=0–123; total=233), respectively.
Estimation
In the state of California during the year 2011, our databases showed that there had been 911,126 surgical procedures performed, and had an incidence of perioperative stroke of 0.33%. Nationally during the same year, the NIS showed that there had been 11,934,162 surgical procedures performed, and had a 0.46% incidence of perioperative stroke. Using our databases from the state of California and the NIS, it can be estimated that in any given year there would be approximately 40,000 to 55,000 perioperative strokes nationally, and its incidence would be close to 0.33% to 0.46% and that constitutes of approximately 6.25% of all strokes that happen in the USA every year [12].
In the state of California during the year 2011 as well, our databases showed that there had been 11,534 CABG and 6,301 carotid endarterectomies (CEAs) performed and had an incidence of perioperative stroke of 1.53% and 1.56%, respectively. Nationally during the same year, the NIS showed that there had been 163,864 CABG and 98,626 CEA surgeries performed and had an incidence of perioperative stroke of 1.76% and 3.04% respectively. In the systematic review performed, studies that reported the incidence of perioperative stroke in CABG and CEA in the United States ranged from 0% to 7.69% in 14 papers (cohort=27,173 patients) and 0% to 4.16% in 22 papers (cohort=32,116) respectively. It can be estimated that in any given year, there would be approximately 2,500 to 3,000 and 1,000 to 3000 perioperative strokes nationally that result from CABG and CEA, respectively.
Discussion
Our study identifies the incidence of perioperative stroke according to the surgical procedure performed as well as gender, age, and race of patients using various databases from the HCUP from 2008 to 2011. A systematic review of the literature was also performed to identify the incidences of perioperative stroke in the United States and other countries published between the years 1980 to 2017. Most perioperative strokes from the HCUP in the present study (86.3%) occurred during the same surgical hospitalization in agreement with other studies that reported the occurrence of perioperative stroke during the first postoperative week [6]. The NIS database during 2008 to 2011 included 48,672,974 weighted hospitalizations, resulted in an overall incidence of perioperative stroke of 0.42%. Results from the state of California and NIS showed similar results according to the incidence of perioperative stroke. There have been no noticeable trends over the incidence of perioperative stroke during the years our data was obtained from, although the incidence of stroke in the general population has been decreasing over the past 20 years due to improvement in blood pressure control and a decrease in smoking prevalence [13].
The results reported from the analysis of our data are consistent with other previous studies, which reported that the overall incidence of perioperative stroke in various surgical procedures ranged between 0.2% and 0.7% [14-17]. Female gender and advanced age have been consistently reported as a risk factor for perioperative stroke; as our California population cohort showed that patients who suffered from perioperative stroke were older (67.6±16.7 years vs. 52.4±21.1 years) [2,17]. The overall incidence of perioperative stroke started increasing after the 4th decade significantly (Figure 1). However, the higher incidence of perioperative stroke in the age group of 0 to 17 years can be explained by the increased rates of certain surgical procedures in pediatrics. Congenital defects that involve the heart and central nervous system would put this age group under surgical procedures that have an increased risk for perioperative stroke [18,19].
Our systematic review showed that the incidence and number of perioperative stroke to be higher in Cardiovascular procedures than non-cardiovascular procedures ranging from 0% to 13.86% (n=0–214; 177 papers) and 0% to 1.05% (n=0–123; 10 papers), respectively. In cardiovascular procedures, most literature had a focus on CEA, CABG, and valvular procedures, with no specific trend or change in the incidence of perioperative stroke in the United States in these or any other surgical procedures over time. Somatosensory evoked potential is mainly used in CEAs to detect and diagnose perioperative strokes [20]. Many studies reported that the incidence of perioperative stroke in procedures like CABG and valvular heart surgeries had higher incidences than carotid surgeries, this could mean that intraoperative monitoring might need to be broadened to include further surgical procedures in order to prevent and manage perioperative strokes.
The different incidences in each surgical procedures can be accounted for various pathophysiologic pathways. Surgical procedures can cause hemodynamic and inflammatory changes that increase the risk of stroke [3,8]. It has been estimated that embolic events cause more than 60% of perioperative strokes, followed by unknown causes (13.9%), a synergistic effect from hypotension, hypoperfusion and formation of microemboli together (10%), hypoperfusion (9%), hemorrhagic strokes (1%), and the remaining 20% is distributed between other minor and unknown causes [3,6,21]. Surgery also has been known to amplify the inflammatory pathways which can initiate or exacerbate cerebral ischemic injury [3,9]. Perioperative hemorrhagic strokes have been linked to sudden surges of cerebral perfusion; revascularization procedures; for example, can lead to cerebral hyperperfusion syndrome that causes acute neurological deficits [21]. Solid organ transplant surgeries have been previously reported to be associated with different neurological complications; stroke specifically was found to be the most common neurologic complication within the first 30 days after transplant, especially in liver, heart, and lung transplant surgeries [22-24]. Zierer et al. [24] explained that there are fundamental factors that contribute to the high incidence of perioperative stroke after heart transplant surgeries, which include prolonged cardiopulmonary bypass and metabolic changes secondary to hepatic failure. Perioperative strokes that occur after neurosurgeries have been linked to local changes and alterations to the physiological regulation of brain vascular circulation, autoregulation, and vasomotricity. These changes vary according to the nature of different tumoral, vascular, infectious or traumatic conditions, different localization, and different surgical technique used in the procedure [25].
Strengths and limitations
This study was conducted using claims databases obtained from the HCUP, as they allow the analysis of a large number of patients and facilitates multi-state and national analysis and comparison. A major strength of this study is its large cohort size, with sufficient cases in each sex, age, and race groups to allow generalizability and population analysis. Furthermore, the usage of POA enables us to differentiate between strokes that occurred as a postoperative complication and patients presenting with strokes.
However, some of the limitations of using claims databases from HCUP include that it depends on proper ICD-9 coding for each diagnosis, as well as its inconsistency and overlapping of the codes of specific procedures that could affect the analysis and results. Although the usage of the POA indicator helps us differentiate between strokes that occurred before the time of admission, there is a possibility that some of the strokes might have happened after admission and before the surgical procedure. Furthermore, the lack of POA in the NIS database can attribute to the slightly higher incidences of perioperative stroke than in the state of California (Table 1) as some of those strokes may have happened at the time of admission and before surgery. The presence of paralysis and other neurologic disorders as the most prevalent comorbidities (Figure 2B) might also indicate that those patients had these comorbidities from a previous medical condition such as a previous stroke. Some limitations of our systematic review include that the incidence of perioperative stroke may have varied in various studies, which may be caused by different diagnostic protocols for strokes in each hospital or healthcare facility. Comorbidities that increase the risk of perioperative strokes such as hypertension, diabetes, and older age may have been more prevalent in some studies more than others and affected the variance of the systematic review.
Conclusions
Further prospective studies are needed in surgical procedures with a relatively high incidence of perioperative stroke to identify further strategies and stratify patients at high risk before the surgical procedures to improve patient counseling and a future potential treatment plan. Perioperative stroke is an underrecognized complication that accounts for about 6% for all strokes that happen in the United States annually.
Supplementary materials
Supplementary materials related to this article can be found online at https://doi.org/10.5853/jos.2019.00304.
Supplementary Material
Surgical subcategories used and the surgical procedures they include
100 surgeries that were most frequently performed
One hundred surgeries that had the highest number of strokes
One hundred surgeries that had the highest incidence of perioperative stroke, with procedure frequency ≥10
ICD-9 codes used in identifying perioperative strokes
Full list of the systematic review
PRISMA 2009 flow diagram. Adapted from Moher et al.188 PRISMA, Preferred Reporting Items for Systematic Reviews and Meta-Analyses.
Supplementary References
Notes
Disclosure
The authors have no financial conflicts of interest.