Hospital Volume Threshold Associated with Higher Survival after Endovascular Recanalization Therapy for Acute Ischemic Stroke
Article information
Abstract
Background and Purpose
Endovascular recanalization therapy (ERT) is becoming increasingly important in the management of acute ischemic stroke (AIS). However, the hospital volume threshold for optimal ERT remains unknown. We investigated the relationship between hospital volume of ERT and risk-adjusted patient outcomes.
Methods
From the National Health Insurance claims data in Korea, 11,745 patients with AIS who underwent ERT from July 2011 to June 2016 in 111 hospitals were selected. We measured the hospital’s ERT volume and patient outcomes, including the 30-day mortality, readmission, and postprocedural intracranial hemorrhage (ICH) rates. For each outcome measure, we constructed risk-adjusted prediction models incorporating demographic variables, the modified Charlson comorbidity index, and the stroke severity index (SSI), and validated them. Risk-adjusted outcomes of AIS cases were compared across hospital quartiles to confirm the volume-outcome relationship (VOR) in ERT. Spline regression was performed to determine the volume threshold.
Results
The mean AIS volume was 14.8 cases per hospital/year and the unadjusted means of mortality, readmission, and ICH rates were 11.6%, 4.6%, and 8.6%, respectively. The VOR was observed in the risk-adjusted 30-day mortality rate across all quartile groups, and in the ICH rate between the first and fourth quartiles (P<0.05). The volume threshold was 24 cases per year.
Conclusions
There was an association between hospital volume and outcomes, and the volume threshold in ERT was identified. Policies should be developed to ensure the implementation of the AIS volume threshold for hospitals performing ERT.
Introduction
Ischemic stroke is one of the leading causes of mortality and morbidity [1]. Endovascular recanalization therapy (ERT) represents a new treatment paradigm for acute ischemic stroke (AIS), and has been examined in seven large-scale studies [2-8]. The American Heart Association/American Stroke Association guideline for the treatment of AIS was revised in 2018, and ERT is considered as important as administration of intravenous alteplase in the treatment of AIS [9]. The hospital volume of ERT has been increasing in Korea since 2015 [10]. Many studies on ERT have examined the patient aspect of treatment, such as decision making (whom and when to treat or not [11]), technical challenges (incapability of access to the occlusive lesion [12]), and the choice of device (aspiration device versus stentriever [8]). However, relatively little research has examined the systemic aspect of providers.
Several studies have shown that hospital volume could be a surrogate marker of outcomes for various surgical conditions and medical procedures [13-16]. Other studies have demonstrated that volume-outcome relationship (VOR) is dependent on disease entity, the type of procedure, and type of outcome measurement [16]. Some studies have shown that volume can be an important marker of ERT success in AIS [17,18]. Eligibility for the Thrombectomy-Capable Stroke Centers certification by the Joint Commission requires a hospital volume of more than 15 ERT cases per year [17,19,20]. However, to our knowledge, no studies have investigated whether this volume threshold is appropriate. Using the concept of VOR, it is possible to estimate the minimum volume of ERT for successful treatment of AIS.
We hypothesized that there would be a difference in clinical outcomes between low-volume and high-volume centers that implement ERT for patients with AIS. We also tried to estimate the volume threshold and identify the existing modifiable structures and processes in the high- and low-volume hospitals.
Methods
Study framework
This study was divided into three parts. The first part was the preparatory process before using the administrative database (DB); we validated ERT patients using an identification method and validated a risk-adjusted mortality model incorporating important clinical variables for ischemic stroke (Figure 1A and B). The second part was to examine VORs by analyzing the association between hospital ERT volume and risk-adjusted outcomes derived from summing the individual-level expected outcomes using the administrative DB (Figure 1C). The third part was to calculate the hospital volume threshold (Figure 1D).
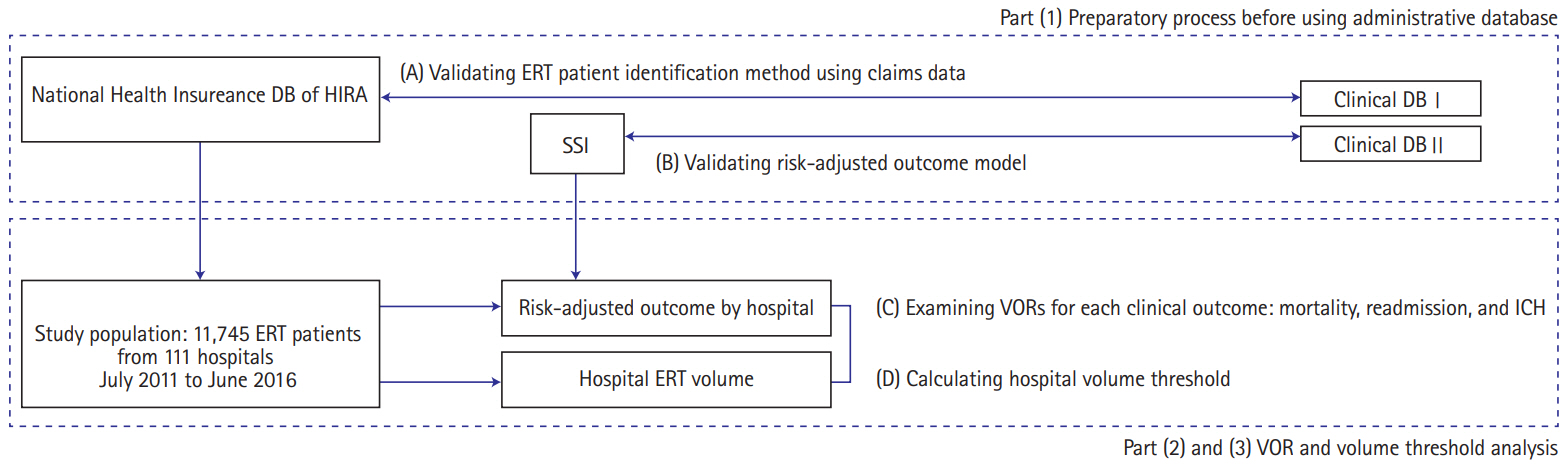
Study framework. DB, database; HIRA, Health Insurance Review and Assessment Service; ERT, endovascular recanalization therapy; SSI, stroke severity index; VOR, volume-outcome relationship; ICH, intracerebral hemorrhage.
Three clinical outcome variables, namely 30-day mortality, 30-day readmission, and postprocedural intracranial hemorrhage (ICH), were selected based on literature review [21-23]. After identifying other variables for building risk adjustment models for three outcomes from the administrative DB for hospital profiling [22], we requested and purchased these variables and other related claims data from the Health Insurance Review and Assessment Service (HIRA) in Korea. Next, we verified the administrative DB with the real-world data (clinical DB I (Figure 1A) from two university hospitals: Dong-A University Hospital (DAUH) and Pusan National University Yangsan Hospital (PNUYH) [24]. We also considered proxy values to replace the National Institutes of Health Stroke Scale (NIHSS), which is difficult to obtain directly from the administrative DB. We used the stroke severity index (SSI) (Supplementary Table 1) [25]. To achieve this, we obtained the clinical DB II (Figure 1B) and the local administrative claims DB of all ischemic stroke patients from the aforementioned university hospitals. The derivation and validation of the proxy values were performed separately using different DBs.
From the administrative DB in the HIRA (the HIRA DB), risk-adjusted outcome models for each of the three outcomes were derived by using multiple regression analysis [22,26]. Many variables, including modified Charlson comorbidity index (mCCI), and SSI were also analyzed in the model derivation (Supplementary Table 2). The mCCI is one of the variables often used for risk adjustment purposes in the studies using administrative DBs [27]. We measured C-statistics to measure the discrimination power for each of the three models. Next, these models were applied to the HIRA DB, and the outcomes were measured. The relationship between the procedural volume per hospital and the outcomes were then plotted and analyzed to identify VOR (Figure 1C). Based on the results of the VOR analysis, the volume threshold was measured. Finally, to investigate the modified structures and processes, a stratified analysis with hospital characteristics was performed (Figure 1D).
All analyses were conducted with the SAS Enterprise Guide statistical software package version 7.13 (SAS Institute Inc., Cary, NC, USA).
Databases and study populations
To gain access to HIRA DB, we submitted an Institutional Review Board approval document from PNUYH to HIRA. There were many datasets including diagnostic codes of cerebrovascular diseases (such as cerebral ischemic stroke and subarachnoid hemorrhage) and various procedural codes (for instance, mechanical and chemical thrombectomy, Levin tube insertion, and coil embolization of intracranial aneurysm.) From these claims data, 12,013 patients with cerebral AIS who underwent ERT from July 2011 to June 2016 in 162 hospitals were selected. Information about patient and hospital were accessed in a deidentified state.
Clinical DB I was a prospective clinical cohort for patients with AIS undergoing ERT in DAUH and PNUYH. The enrollment period was the same as in the HIRA DB. Clinical DB II was a cohort of all patients with AIS in addition to ERT patients during the same enrollment period and linked with the local claims database of the same patients (Figure 1A and B).
Validity of identifying ERT patients using an administrative database
Although the HIRA DB was used in a de-identified state, it did provide geographical information (city and district). Combining this information with the relative volume of ERT, we produced the DAUH and the PNUYH cohorts from the HIRA DB. To validate these cohorts, a 2×2 contingency table was created, and Clinical DB I was defined as the gold standard. Pearson’s chisquare test and Student's t-test were used to compare the administrative and clinical databases (Methods section in Supplementary appendix [24,25,27-31]).
Validation of stroke severity index
To derive the SSI, the association between NIHSSs of patients with AIS and SSI were analyzed for all patients with AIS of the DAUH (prediction model). Subsequently, the model was validated with the PNUYH data. The correlation coefficients were 0.70 for the prediction model and 0.68 for the validation model (Supplementary Table 3). The correlation coefficients of both models were similar to those in a previous paper [25] and usually considered relatively high. However, “intensive care unit stay” showed no significant statistical power (Supplementary Table 4). Multiple linear regression analysis was used for creating the SSI model, and Pearson’s chi-square test was used for validating the model (Figure 1B, Methods section in Supplementary appendix).
Analysis
Risk-adjusted outcome models
We operationally defined three outcome variables based on previous research [22]. The 30-day mortality was defined as ‘all deaths from any cause in any hospital within 30 days after initial admission and the ERT procedure.’ Patients who were admitted to multiple hospitals during their AIS episode were assigned to the hospital that performed the ERT procedure [22]. Thirty-day readmission was defined as ‘readmission to the same hospital from any cause within 30 days after initial admission and the ERT procedure.’ Symptomatic ICH was defined as ‘no pre-existing ICH code before the ERT procedure, and an occurrence of ICH within 30 days after the initial admission and ERT procedure.’
To examine the association between hospital ERT volume and clinical outcomes, risk-adjusted outcome prediction models were built using a multi-level analysis method (Methods section in the Supplementary appendix) [22,26].
The evidence of distinction between individual-level and hospital-level variables were based on the fact that the random effect on the combined hospital-level outcome was different. In the case of NIHSS, for example, if NIHSS values of patients receiving thrombectomy in different hospitals are distributed relatively equal to each other, adjusting this variable will have a relatively small impact on patient outcomes. We set the hospital-level variable to be able to influence the prognosis of the patient, and at the same time, to be able to function differently according to each hospital [22].
Simple and multiple logistic regression analyses were performed to select appropriate parameters of risk adjustment modeling. To make final risk adjustment modeling, the multi-level logistic linear regression method was used. C-statistics were used for validation of the risk adjustment model.
Volume-outcome relationships analysis
We examined VORs according to the standard hospital profiling approach used by the Centers for Medicare and Medicaid Services (CMS) of the United States [22]. The approach was as follows: (1) the crude rates for each of the three outcomes were obtained on an individual patient basis; (2) each risk adjustment model was created and applied to each individual patient; (3) following the same method, the individual patient’s expected outcome variable (for instance, risk-adjusted 30-day mortality chance, risk-adjusted 30-day readmission chance) was calculated; (4) outcome values were summed on a hospital basis; and (5) these summed hospital-level outcome values were divided by the hospital volumes. Univariate analyses were performed for all individual and hospital-level variables to determine which variables were incorporated in the multi-level model and examine the problem of multicollinearity.
Using the ratio between the crude hospital-level outcome and the expected hospital-level outcome, the observed to expected ratio (O/E ratio) was calculated and multiplied by the total average outcome rate. This result was defined as the final risk-adjusted outcome value of each hospital. We chose the O/E ratio rather than the predicted to expected ratio (P/E ratio) because the assumption of this P/E ratio method is that there is no VOR [32]. Pearson’s and Spearman’s correlation analyses were used for VOR distribution, and Pearson’s chi-square test was used for quartile group analyses (Figure 1C).
Estimation of hospital volume threshold
The hospital volume threshold was calculated by examining the relative effect on the adjusted outcome odds for an increasing hospital volume of 10 patients for a given hospital size, and varying the given hospital size from an annual volume from boundary value between quartile groups, increments of one case per year. Ten cases were selected as a standardized increment. The rationale for the use of 10 cases as a reference is the relative value of the results of Ross et al. [33] The volume threshold was set to the point at which the odds for an outcome approached 1 as the total volume fell. This method was taken from Ross et al. [33], and was slightly modified for this study.
To calculate the volume threshold, we sorted all the hospitals’ 5-year volumes, divided them into four groups, and measured the relationships between volume and outcomes. Before sorting hospitals by their volume, a substantial proportion of hospitals (51 hospitals) were excluded for two reasons, the first reason being no record of cases between July 2015 and June 2016, and the second being a total number of cases that was less than 20 over 5 years. Restricted cubic spline regression was used for volume threshold estimation. Fisher’s exact test was used to analyze the relationship between hospital volume group and the presence of stroke unit and teaching status (Figure 1D).
Results
Baseline characteristics of the administrative database
Baseline characteristics are shown in Table 1. Of the 111 hospitals included in the VOR analysis, the ERT volumes corresponding to half of all patients were performed in 21 hospitals. Age and the proportion of comorbidities appeared to be higher in the first quartile group than in the other groups.

Baseline characteristics of administrative database, according to medical condition and hospital volume quartile group
A total of 51 hospitals (31.4%) were excluded in the VOR analysis due to very low hospital volumes. VOR analyses were conducted on the total number of cases for the remaining 111 hospitals, which was 11,745 (97.7% of the original 12,013 cases). The sample was divided into four groups to have roughly the same number of patients in each group. About 2,900 cases from the most voluminous hospitals were categorized as the first quartile (more than 61 cases per year), the second quartile (31 to 60 cases per year), the third quartile (19 to 30 cases per year), and the fourth quartile (less than 18 cases per year) (Table 1).
Hospital volumes analyses
Over 5 years, 12,013 ERT procedures were performed (Table 1). Some patients (0.009%) had undergone the procedure twice (n=111) or three times (n=2). Of the 162 hospitals, 21 did not perform the ERT procedure between July 2015 and June 2016. The mean volume was 14.8 cases per year, and 59 hospitals (38%) had a volume that was higher than the mean. The overall 30-day mortality rate was 11.6%, 30-day readmission rate was 4.6%, and postprocedural ICH rate was 8.6%.
Validating ERT patient identification
The results of validating ERT patient identification were a sensitivity of 83.2%, a specificity of 98.8%, and a positive predictive value of 80.2% (Figure 1A). To evaluate the discrepancies, in-depth analyses were performed for the 115 true positives and 42 false negatives of the PNUYH cases (Supplementary Tables 5 and 6).
Validation of risk-adjusted outcome models
To solve the multicollinearity problem, other variables included in the SSI were excluded from the univariate analysis, and the statistical model was applied. In the case of mortality, the variables applied to the model were age, SSI, mCCI, sex, hypertension, and atrial fibrillation. The C-statistics of the final mortality rate model was 0.8146, which was higher than the initial target value of 0.8. Similarly, the same modeling was done for the readmission rate, and included variables were SSI, mCCI, age, transient ischemic attack, prior stroke, and female sex. The C-statistic was 0.6052, which was relatively low. For postprocedural ICH rate, individual-level variables, such as age, SSI, intracranial arterial stenosis, myocardial infarction, hypertension, and transient ischemic attack were selected. ‘Teaching status: resident’ was included at the hospital-level. The final model C-statistic was 0.6841 (Supplementary Figures 1-3).
Volume-outcome relationships analyses
For mortality rate comparison between quartile groups, the odds ratio (OR) showed differences between the 1st and 3rd quartiles, and between the 1st and 4th quartiles in the crude outcome model (P<0.05). However, in the adjustment model, the OR showed differences among the groups from the 2nd to the 4th quartile (1st vs. 3rd, P=0.003; 1st vs. 4th, P<0.001). Similar results were obtained on comparing readmission and postprocedural ICH rates among quartile groups (Table 2). In the distribution analysis, three outcomes of both crude and risk-adjusted models showed negative correlations, but there were no statistically significant results (Supplementary Figures 4-6).

Relationship between the hospital volume quartile and the odds ratio of 30-day mortality, readmission, and intracranial hemorrhage rates of endovascular recanalization therapy in acute ischemic stroke, 2011–2015 (n=111)
Estimation of volume threshold and evaluation of modifiable ‘structures and processes’
In the between quartile comparison of hospital volume, there was a significant difference in the OR between the 1st and 2nd quartiles for the risk-adjusted mortality rate, and between the 1st and 4th quartile for the risk-adjusted postprocedural ICH rate. Based on this, we concluded that there was a VOR for ERT in patients with AIS, and subsequently estimated the volume threshold.
It was assumed that the threshold would exist between the volume of the boundary point between the 2nd quartile (less than 60 cases per year) and the boundary point of the 4th quartile (more than 19 cases per year). Between 60 and 19 cases per year, we assessed volume threshold using a modified method presented in a previous paper [33]. In this process, a reversed J-shaped curve was created, and the threshold was set to the point at which the odds for mortality approached “1.0” as the total volume falls. Thus, at the highest value of the J-curve, 22 cases per year corresponded to the inflection point, and 24 cases per year corresponded to where the odds fell below 1. Based on this, we set 24 cases per year as the VOR threshold of ERT for AIS (Figure 2).
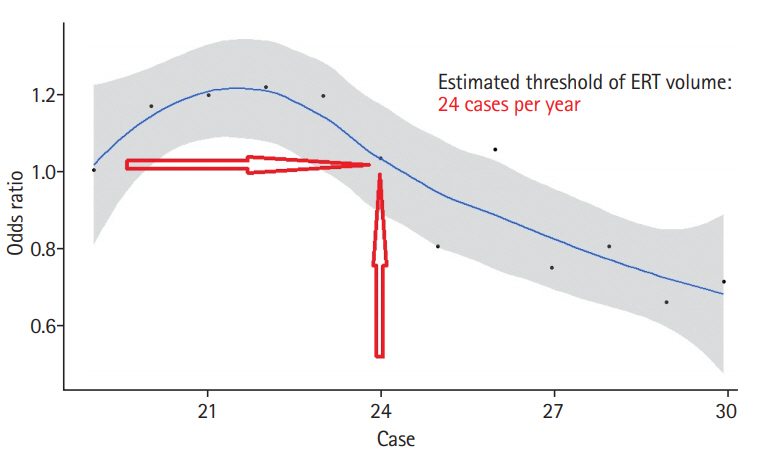
Predicted effect of an increase of 10 patients in annual procedure volume on the adjusted odds of mortality in Korea, 5 years. ERT, endovascular recanalization therapy
To identify modifiable ‘structures and processes,’ additional analyses were conducted regarding the two hypothesized hospital-related variables, stroke unit [28], and teaching status [29]. Of the 111 hospitals included in the analysis, 50 hospitals (45%) had stroke units, and teaching status hospitals accounted for 79% of all hospitals. The proportions of hospitals with stroke units and teaching status decreased from the 1st to 4th quartile group, and was statistically significant in the fourth quartile group. Due to dichotomization of the classification according to the value determined by the volume threshold, significant differences were found in the proportion of both stroke unit and teaching hospitals between the two quartiles (Table 3).
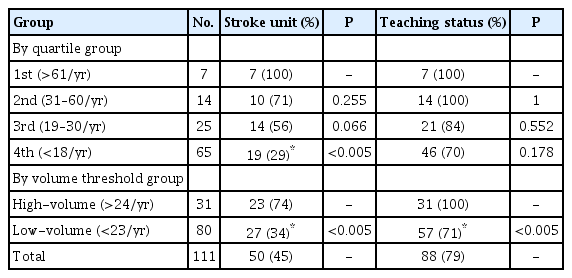
Relationship between the hospital volume group and the presence of stroke unit and teaching status
Discussion
In this study, we calculated the minimum hospital volume of ERT for AIS required to maintain minimum treatment quality. Volume threshold was calculated using a spline regression method and was identified to be 24 cases per year. By using the threshold value, hospitals could adhere to the healthcare policies concerning ERT. However, finding the volume requirement alone does not reflect quality, but could be a proxy value [30].
There are two classical theories of why a VOR is present. The first is the idea of “practice-makes-perfect,” and the second is “selective-referral pattern.” These theories seem to have been relevant in various previous studies [14,15]. In our study, it is difficult to distinguish which of the two theories is most relevant. Some researchers have suggested that the relationship between volume and “structure and process,” and the relationship between outcome and “structure and process” should be further analyzed, which will allow the actual working mechanism underlying VOR to be identified [30].
In the VOR analyses, we found no relationship between readmission and hospital volume. It can be assumed that a high readmission is indicative of a poor prognosis. However, readmission in the current study may have been due to the need to perform endarterectomy or carotid artery stenting after the acute phase management of stroke. In Korea, if the treatment period is extended, the patient may be discharged from the hospital and re-hospitalized due to technicalities surrounding the insurance system. Therefore, it is possible that the high readmission rate was not related to prognosis.
By using the threshold value identified in this study, stroke centers may be able to better adhere to the healthcare policies concerning ERT. Indeed, such thresholds can guide the designation of a comprehensive stroke center by setting up the manpower and facilities required for the investment. For example, additional stroke centers could be placed in an area where an overtasked comprehensive stroke center is already located, which would allow more than 24 ERT cases to be taken on annually. There is a method to encourage programs in high-volume hospitals; for example, stroke units. This is also associated with qualitative improvement in overall stroke management. If patients are concentrated in a high-volume center but can be dispersed to surrounding centers, the overall outcomes in the region are likely to be better.
Conversely, some studies have shown that when patients were transferred to a high-volume center, the results were better than those from a low-volume center [34]. However, we do not agree with this interpretation because if patients are concentrated in one hospital, it is likely that surgery or other procedures are only required in emergency situations in low-volume centers. It is possible that the overall stroke care system’s quality would be lowered in such situations due to increased transfer time of the patient.
A previous study defined the cut-off value of a high-volume center as 50 cases per year [18]. However, there seemed to be no scientific basis for this threshold. Another study investigated the correlation between the ERT procedure volume and the outcome in AIS, and defined 10 procedures as the cut-off value by dividing centers into low and high-volume [35]. However, they found no VOR after risk adjustment. These studies are also outdated, and the knowledge and equipment used in ERT have since changed. Therefore, we suggest that these studies be understood contextually in their relevant time period.
The present study has some limitations. First, there is a data reliability problem of hospitals when using administrative data. This limitation was overcome by comparing administrative and clinical databases. Second, the database did not allow us to identify other factors such as door to puncture time, initial the Alberta Stroke program early CT score (ASPECTS), basal collateral blood flow status of the patient, early neurological deterioration, presence of intravenous alteplase, and transference from primary stroke center. Because of this, the statistical power of the prediction models was limited. Third, because we analyzed the data at the level of the hospital, we did not analyze the outcomes by individual interventionist. Despite these drawbacks, trend analysis using administrative data and comparison between hospitals was considered appropriate because it could be a viable way to treat the current data.
Conclusions
To conclude, we found an association between hospital volumes and risk-adjusted outcomes of ERT. We defined the hospital volume threshold of ERT procedures as 24 cases per year. The risk adjustment method using the SSI was taken from a study conducted in Taiwan that was customized to the Korean medical environment. The trends of volumes and outcomes were traced and utilized as a quality indicator of ERT procedures. Although the volume threshold of ERT can be used as reference values to guarantee good outcomes, other factors are likely to affect the outcome of ERT in patients with AIS. Therefore, this threshold value should be used with caution.
Supplementary materials
Supplementary materials related to this article can be found online at https://doi.org/10.5853/jos.2019.00955.
Supplementary appendix
Seven parameters of stroke severity index and its explanation
Parameters for risk adjustment: individual and hospital level
Regression statistics of stroke severity index model
Multiple linear regression model for the stroke severity index (regression coefficient was 0.685)
Characteristics of the patients in clinical databases (n=4,932)
Comparison of the clinical and administrative databases (n=4,932)
1. (A) Selected risk adjustment variables of 30-day mortality models with each odds ratios and 95% confidence intervals and (B) receiver operating characteristic (ROC) curve. SSI, stroke severity index; CCI, Charlson comorbidity index; HTN, hypertension; ICAS, intracranial arterial stenosis; AF, atrial fibrillation.
(A) Selected risk adjustment variables of 30-day readmission models with each odds ratios and 95% confidence intervals and (B) receiver operating characteristic (ROC) curve. SSI, stroke severity index; CCI, Charlson comorbidity index; TIA, transient ischemic attack.
(A) Selected risk adjustment variables of symptomatic intracerebral hemorrhage models with each odds ratios and 95% confidence intervals and (B) receiver operating characteristic (ROC) curve. SSI, stroke severity index; ICAS, intracranial arterial stenosis; MI, myocardial infarction; HTN, hypertension; TIA, transient ischemic attack.
Plotted graphs of hospital crude (A) and risk-adjusted (B) 30-day mortality rate and endovascular recanalization therapy volumes for 5 years (n=111). Pearson correlation coefficient of –0.21 (P=0.03). However, in the risk-adjusted 30-day mortality model, the correlation coefficient was –0.03 (P=0.71).
Plotted graphs of hospital crude (A) and risk-adjusted (B) 30-day readmission rate and endovascular recanalization therapy volumes for 5 years (n=111). Both crude (–0.13) and risk-adjusted (–0.15) models showed a negative correlation. Both models showed statistically insignificant values (P=0.20 and P=0.14).
Plotted graphs of hospital crude (A) and risk adjusted (B) symptomatic intracranial hemorrhage rate and endovascular recanalization therapy volumes for 5 years (n=111). Both crude and risk-adjusted models showed a negative correlation (–0.16 and 0.03) and were statistically insignificant (P=0.11 and P=0.73)
Notes
Disclosure
The authors have no financial conflicts of interest.
Acknowledgements
The authors would like to thank Professor Han Moon Hee (Radiology), Young-Ho Kang (Health Policy and Management), and Aesun Shin (Preventive Medicine) from Seoul National University School of Medicine, and Sun U. Kwon (Neurology) from Asan Medical Center, University of Ulsan College of Medicine, for the critical review and comments on the manuscript.