Reliability and Clinical Utility of Machine Learning to Predict Stroke Prognosis: Comparison with Logistic Regression
Article information
 , KOSNI Investigators
Dear Sir:
The accurate prediction of functional recovery after a stroke is essential for post-discharge treatment planning and resource utilization. Recently, machine learning (ML) algorithms with baseline clinical variables have demonstrated better performance for predicting the functional outcome of ischemic stroke compared with preexisting scoring systems developed by conventional statistics [1,2]. However, most studies compared model performance by area under curve (AUC) only, and ML and conventional statistical approaches were not sufficiently evaluated in terms of the reliability and clinical utility [3]. We aimed to compare the performance of the ML with that of the conventional logistic regression (LR) model by evaluating accuracy, reliability, and clinical utility using AUC comparison, calibration, and decision curve analysis to predict the outcome of a stroke using KOrean Stroke Neuroimaging Initiative (KOSNI) database.
Using clinical variables measurable at admission (Supplementary methods 1), we used various ML algorithms including deep learning (DL), support vector machine (SVM), random forest (RF), XGboost (XGB), and conventional LR models for predicting 3-month modified Rankin Scale (mRS) >2 or 1 (Supplementary methods 2). Receiver operating characteristic (ROC) curve analysis was performed to evaluate the sensitivity and specificity of each model across each decision threshold. Calibration was evaluated using a reliability diagram and expected calibration error (ECE) to assess the reliability of estimates between the predicted and actual outcomes [4]. The decision curve analysis was constructed to assess the clinical utility of various developed models (Supplementary methods 3) [5].
Six thousand seven hundred thirty-one patients included from 10 tertiary stroke centers in South Korea. This study was approved by the Institutional Review Boards of all participating institutions and comprehensive written informed consent was obtained from patients enrolled in the prospective study. Four thousand seven hundred nine (70%) of the datasets from the former part in the order of admission date were used for training, whereas the remaining 2,019 (30%) from the latter were used as a test set for evaluating the final performance. The baseline characteristics stratified by the outcomes were summarized in Supplementary Table 1.
When the predictive ability was compared with the LR model (AUC of the ROC curve: 0.860 for predicting mRS >2; 0.831 for predicting mRS >1), DL achieved AUC of 0.864 for predicting mRS >2 (P=0.11) and 0.834 for predicting mRS >1 (P=0.06), which was not statistically different. The AUC of SVM, RF, and XGB were 0.871 (P<0.001), 0.870 (P=0.01), and 0.871 (P<0.01) for mRS >2, 0.838 (P<0.001), 0.844 (P<0.001), and 0.843 (P<0.001) for mRS >1 respectively, which demonstrated better performance than the LR model (Figure 1). The detailed confusion matrix and accuracy are described in Supplementary Table 2. In the reliability diagram, the ECE values of SVM was the lowest for predicting both mRS >2 (0.020) and mRS >1 (0.037), suggesting that the SVM model was the most calibrated (Figure 2). The decision curve analysis indicated that the level of clinical benefit throughout the risk thresholds were similar for various ML and LR models (Figure 2).

Receiver operating characteristic curve of classifiers to predict modified Rankin Scale (mRS) >2 (A) and mRS >1 (B). The P-value was calculated using DeLong’s test for the curve of logistic regression (LR) and the machine learning model. AUC, area under curve; DL, deep learning; SVM, support vector machine; RF, random forest; XGB, XGBoost.
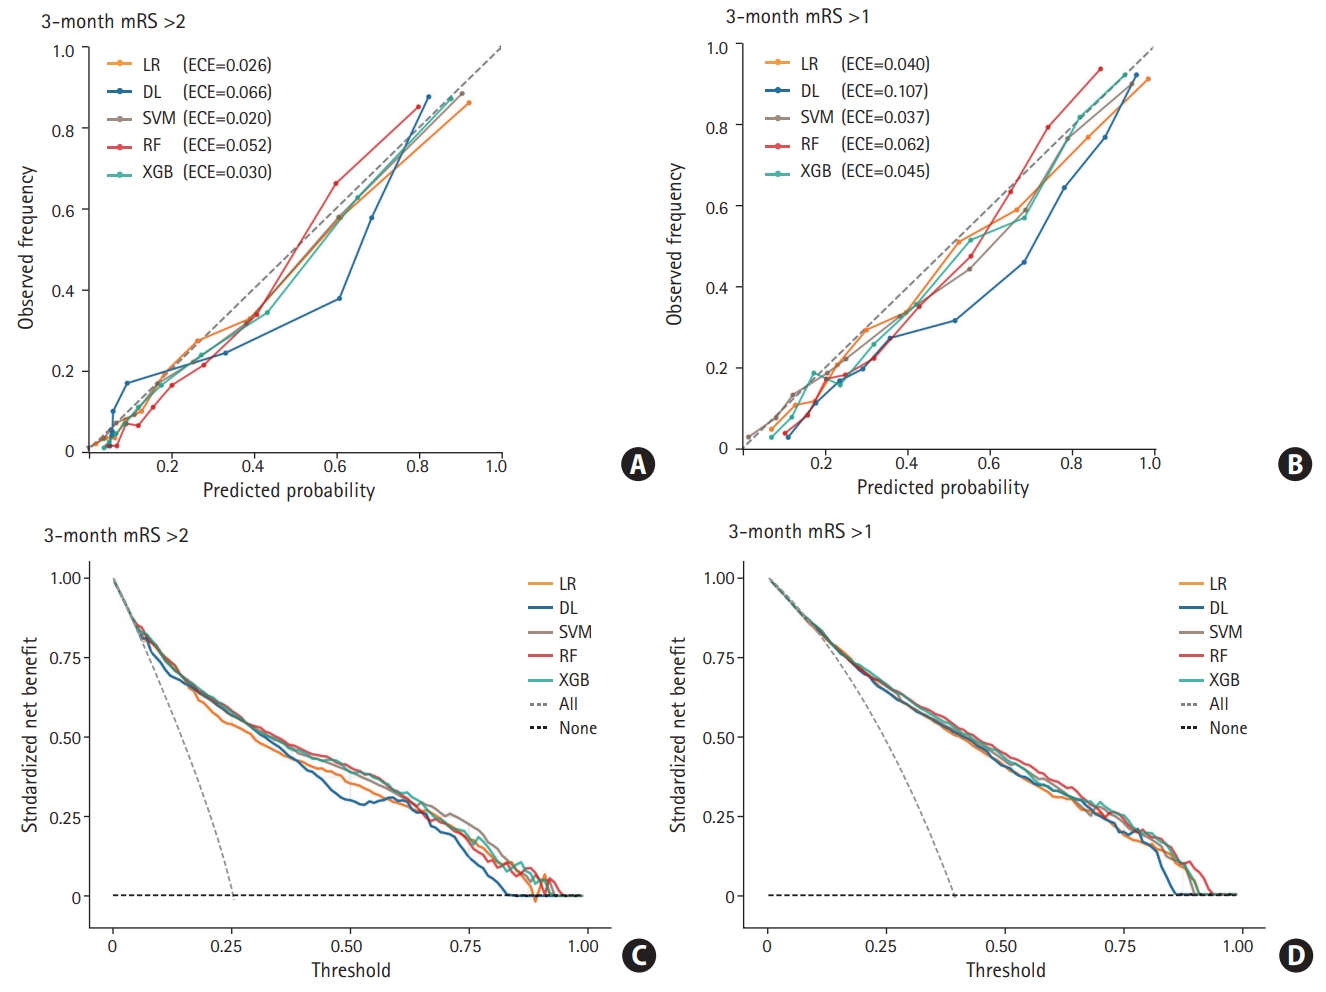
Comparison of calibration and clinical utility in different algorithms (A, B) reliability diagram (C, D). Decision curves of models which predict 3-month (A, C) modified Rankin Scale (mRS) >2 and (B, D) mRS >1. LR, logistic regression; ECE, expected calibration error; DL, deep learning; SVM, support vector machine; RF, random forest; XGB, XGBoost.
Our study shows that ML models had better discriminated power evaluated by AUC and reliability in predicting clinical outcome after a stroke than conventional LR models. It should be noted that, however, both ML and LR models demonstrated moderate-to-good performances, and ML model did not outperform LR models in terms of clinical utility.
This study has the advantage that we evaluated reliability and clinical utility of the models in addition to discriminated power comparison. The assessment of the agreement between the predicted and actual outcomes on the calibration plot is a requisite for model validation [6]. Also clinical net benefit needs to be evaluated using decision curve analysis [7]. The results indicate ML was also comparable or superior to LR in terms of reliability and clinical net benefit.
ML is effective in dealing with wide data where the number of variables per study subjects is relatively large and interactions between variables exist [8]. Introducing mixed-media data including image (computer tomography, magnetic resonance imaging), biosignal data acquired from continuous monitoring (blood pressure, heart rate, electrocardiography, and electroencephalography) in the analysis in addition to clinical variables with numeric, symbolic features may enable us to develop more accurate predictive ML model [9]. Training to predict an outcome with strong signal-to-noise ratio rather than an outcome of poor signal-to-noise ratio such as clinical outcome prediction may also improve performance power of ML [3].
The limitation of our study is that we only use baseline clinical variables and treatment-related factors were not included for model construction. Variables associated with acute stroke management to prevent stroke progression or recurrence and patient’s will for active rehabilitation could have a significant impact on functional recovery.
In conclusion, our study revealed that ML algorithms using baseline clinical parameters had better accuracy, reliability, and similar clinical net benefits to the traditional LR models in predicting functional recovery after an acute ischemic stroke.
Supplementary materials
Supplementary materials related to this article can be found online at https://doi.org/10.5853/jos.2020.02537.
Characteristics of patients based on outcomes
Confusion matrix and accuracy
Selection of variables which were used as input for model
Developments of model
Evaluation of reliability and clinical benefit
Acknowledgements
This research was supported by grants from the Korea Health Technology R&D Project through the Korea Health Industry Development Institute (KHIDI), funded by the Ministry of Health and Welfare, Republic of Korea (grant numbers: HI18C2383 and HI12C1847).
Notes
The authors have no financial conflicts of interest.