Mechanical Thrombectomy in Patients with a Large Ischemic Volume at Presentation: Systematic Review and Meta-Analysis
Article information

Abstract
The benefits of mechanical thrombectomy (MT) for patients with acute ischemic stroke (AIS) and a large ischemic core (LIC) at presentation are uncertain. We aimed to obtain up-to-date aggregate estimates of the outcomes following MT in patients with volumetrically assessed LIC. We conducted a Preferred Reporting Items for Systematic reviews and Meta-Analyses (PRISMA)-conformed, PROSPERO-registered, systematic review and meta-analysis of studies that included patients with AIS and a baseline LIC treated with MT, reported ischemic core volume quantitatively, and included patients with a LIC defined as a core volume ≥50 mL. The search was restricted to studies published between January 2015 and June 2020. Random-effects-meta-analysis was used to assess the effect of MT on 90-day unfavorable outcome (i.e., modified Rankin Scale [mRS] 3–6), mortality, and symptomatic intracranial hemorrhage (sICH) occurrence. Sensitivity analyses were performed for imaging-modality (computed tomography-perfusion or magnetic resonance-diffusion weighted imaging) and LIC-definition (≥50 or ≥70 mL). We analyzed 10 studies (954 patients), including six (682 patients) with a control group, allowing to compare 332 patients with MT to 350 who received best-medical-management alone. Overall, after MT the rate of patients with mRS 3–6 at 90 days was 74% (99% confidence interval [CI], 67 to 84; Z-value=7.04; I2=92.3%) and the rate of 90-day mortality was 36% (99% CI, 33 to 40; Z-value=–7.07; I2=74.5). Receiving MT was associated with a significant decrease in mRS 3–6 odds ratio (OR) 0.19 (99% CI, 0.11 to 0.33; P<0.01; Z-value=–5.92; I2=62.56) and in mortality OR 0.60 (99% CI, 0.34 to 1.06; P=0.02; Z-value=–2.30; I2=58.72). Treatment group did not influence the proportion of patients experiencing sICH, OR 0.96 (99% CI, 0.2 to 1.49; P=0.54; Z-value=–0.63; I2=64.74). Neither imaging modality for core assessment, nor LIC definition influenced the aggregated outcomes. Using aggregate estimates, MT appeared to decrease the risk of unfavorable functional outcome in patients with a LIC assessed volumetrically at baseline.
Introduction
Intracranial mechanical thrombectomy (MT) is the first line treatment strategy for selected patients with acute ischemic stroke (AIS) due to proximal vessel occlusion (PVO) [1]. Amongst factors associated with treatment benefit over best medical treatment (BMT) alone, is the baseline ischemic core volume, known to be strongly associated with worse outcome [2,3]. A large initial ischemic core volume being associated with poor clinical outcome, most trials that validated MT as standard of care excluded patients with Alberta Stroke Program Early CT Scores (ASPECTS) below 6, or ischemic cores above 70 mL precluding to draw strong conclusions in patients with a deemed unfavorable imaging profile at presentation. Yet, growing evidence has shown that a subsample of these patients may benefit from revascularization, even if outside currently validated eligibility criteria for MT [4].
In the complexifying framework of patients’ selection for MT, several computational solutions offer near real-time quantification of ischemic core and salvageable tissue, using computed tomography-perfusion (CTP) or magnetic resonance (MR)-perfusion and magnetic resonance imaging (MRI) diffusion weighted imaging (DWI) post processing [5]. Although ASPECTS is a handy and validated tool known to correlate with the ischemic core volume, the correlations are weaker for large ischemic cores (LICs; i.e., low ASPECTS) and there’s not been to our knowledge a comprehensive aggregate analysis of the outcomes of patients with AIS-PVO, treated with MT (vs. BMT) and a LIC at baseline, assessed only with quantitative core volume measures.
In this systematic review and meta-analysis of current data, we aimed to investigate the outcomes of patients with baseline LIC volumes, assessed quantitatively, treated with BMT with or without MT.
Methods
This report was prepared with reference to the Preferred Reporting Items for Systematic reviews and Meta-Analyses (PRISMA) [6] and the Cochrane Handbook for Systematic Reviews of Interventions. No ethical approval was seeked as only data from previously published studies in which informed consent was obtained were retrieved and analysed. The summary protocol was developed in-house in August 2020, and registered through the international database of prospectively registered systematic reviews PROSPERO (registration number, 2020 CRD42020125428). This study was conducted and reported independently of industry or the ongoing trials of MT for patients with LICs.
Search strategy and selection criteria
Using PubMed, we identified potentially eligible studies that have reported baseline imaging characteristics including a volumetric assessment of the ischemic core using CTP or diffusion weighted sequence as well as the 3-month modified Rankin Scale (mRS) in patients that received BMT with or without MT. Our search covered the period January 1st 2015 to June 1st 2020 (search last updated on June 1st 2020) and was conducted using the following keyword/MeSH term search strategy: ((((large[All Fields] AND volume[All Fields]) OR (low[All Fields] AND aspects[All Fields])) OR (low[All Fields] AND dwi-aspects[All Fields])) AND ("thrombectomy"[MeSH Terms] OR "thrombectomy"[All Fields])) OR ((((large[All Fields] AND volume[All Fields]) OR (low[All Fields] AND aspects[All Fields])) OR (low[All Fields] AND dwi-aspects[All Fields])) AND endovascular[All Fields]) AND ("2015/01/01"[PDAT] : "2020/12/31"[PDAT]). There was no language restriction. Additional references were identified by reviewing the reference lists of potentially eligible papers and author’s files. To increase the sample size and provide the most up-to-date estimates, we also searched the published abstracts reported at the two most recent large stroke conferences: the International Stroke Conference (ISC) 2018–2019 and the European Stroke Organisation Conference (ESOC) 2018–2019. We excluded case reports. In case of multiple publications from overlapping cohorts, the study with the largest cohort was included.
Data extraction
Data were extracted independently by three investigators (B.K., K.J., G.B.) using a standardized data collection form. Disagreements were resolved by consensus. The data collection form was subdivided into three sections: (1) study characteristics; (2) baseline demographic, clinical and imaging characteristics of stroke patients; and (3) outcome measures (as defined below).
Risk of bias assessment
Risk of bias was critically appraised based on the scheme suggested by the Cochrane Collaboration Tool (ROBINS-I to Assess Risk of Bias in Cohort Studies) [7] by two authors who reviewed the literature (B.K., G.B.) (Supplementary Table 1).
Of note, one of our candidate paper was an individual patient level data (IPD) meta-analysis [8] of randomized control studies [9,10]. We have chosen to include this IPD meta-analysis rather than the original randomized control trials (RCTs) since the aggregated analysis contained relevant subgroups analysis which were not available from the initial RCTs manuscripts. A dedicated risk-of-bias tool does not exist for individual patients data pooled in meta-analyses. Hence after consultation of the Cochrane Risk of Bias Team (risk-of-bias@bristol.ac.uk), we assessed individually the risk of bias of both RCTs individually with the appropriate RoB-2 tool (Supplementary Table 2) [11].
Quality of included studies
We used the Newcastle–Ottawa Scale for assessing the quality of the included studies (Supplementary Table 3). Further, we assessed quality of reporting (but not validity) of all included studies based on The Strengthening the Reporting of Observational Studies in Epidemiology (STROBE) statement’s [12] checklist, used to build a quality score of 0–28. The scores were then defined as follow: 0–10, inadequate data to assess; 10–14, poor; 15–19, acceptable; 20–28, good. The score was built by assessing in each report the STROBE criteria (0–22), adding one point for each of the following items when positive: prospective study design (item 23), lost to follow-up and excluded patients less than 10% (item 24), no selection of specific groups (item 25), blinding in outcome evaluation (item 26), informed consent (item 27), and consecutive recruitment (item 28) (Supplementary Table 4).
Outcome measures
The primary outcome measure was an unfavorable clinical outcome, defined as a mRS of 3 or more at 90 days. Secondary outcome included 90-day mortality, and the rate of symptomatic intracranial hemorrhage (sICH) as per the Second European-Australasian Acute Stroke Study (ECASS II) criteria [13].
Statistical analysis
Data were pooled in a meta-analysis when at least two studies with relevant data were available. The cumulative rate (percentage) and 99% confidence interval (CI) for each outcome was computed for each column. Heterogeneity of the data was assessed by the Higgins index (I2), and visually through inspection of the forest-plot. For high levels of heterogeneity (I-squared >50%), the DerSimonian and Laird random-effects model was applied [14]. We conducted the statistical analysis two ways.
First, we computed a cumulative meta-analysis of unfavorable outcome, mortality, and sICH rates in patients that received MT. Weighted random effects meta-regression analysis was performed to assess the influence of potential effect modifiers: we tested the relationship between the modality for ischemic core segmentation (CTP or MR-DWI), the study specific definition of a LIC volume (core ≥50 or ≥70 mL) in patients with MT and the rate of 90-day unfavorable outcome. To verify the consistency of outcome meta-analysis results, the influence of each individual study on the summary effect estimate was assessed by the sensitivity analysis (‘leave-one-out’ approach). To evaluate the heterogeneity and bias, the subgroup analysis and funnel plot followed by Egger’s linear regression test were performed, respectively. In addition, we performed meta-regression analyses to test the association between the rate of favorable outcome and mean baseline core volumes when available. To compare the percentages of each group and to calculate the P-values, the z-test was used when appropriate. Second, we computed a mixed effect analysis of MT effect, by meta-analyzing the rates of favorable outcome in patients treated with BMT with or without MT. Statistical significance was set at P<0.05. All analyses were conducted using comprehensive meta-analysis (CMA v.3, Borenstein et al. Biostat, Englewood, NJ, USA).
Results
Literature review and study selection
Amongst 622 studies screened for inclusion and two records yielded from other sources between 2015 and June 2020, a total of 10 records [3,6,8,15-21] with 954 patients with baseline large ischemic volumes were included in our review. See flowchart of studies selection in Figure 1. General characteristics of the included studies are detailed in Table 1.
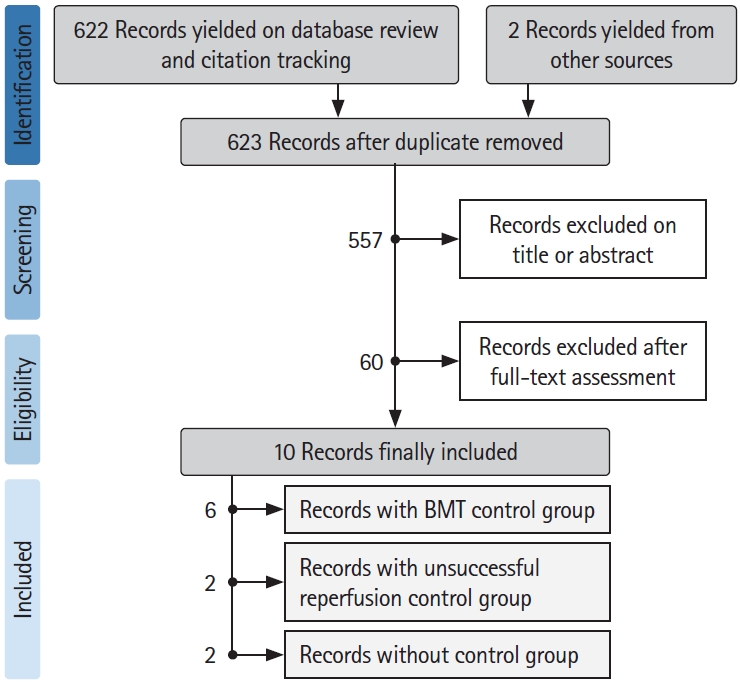
Flowchart for studies selection. BMT, best medical treatment.
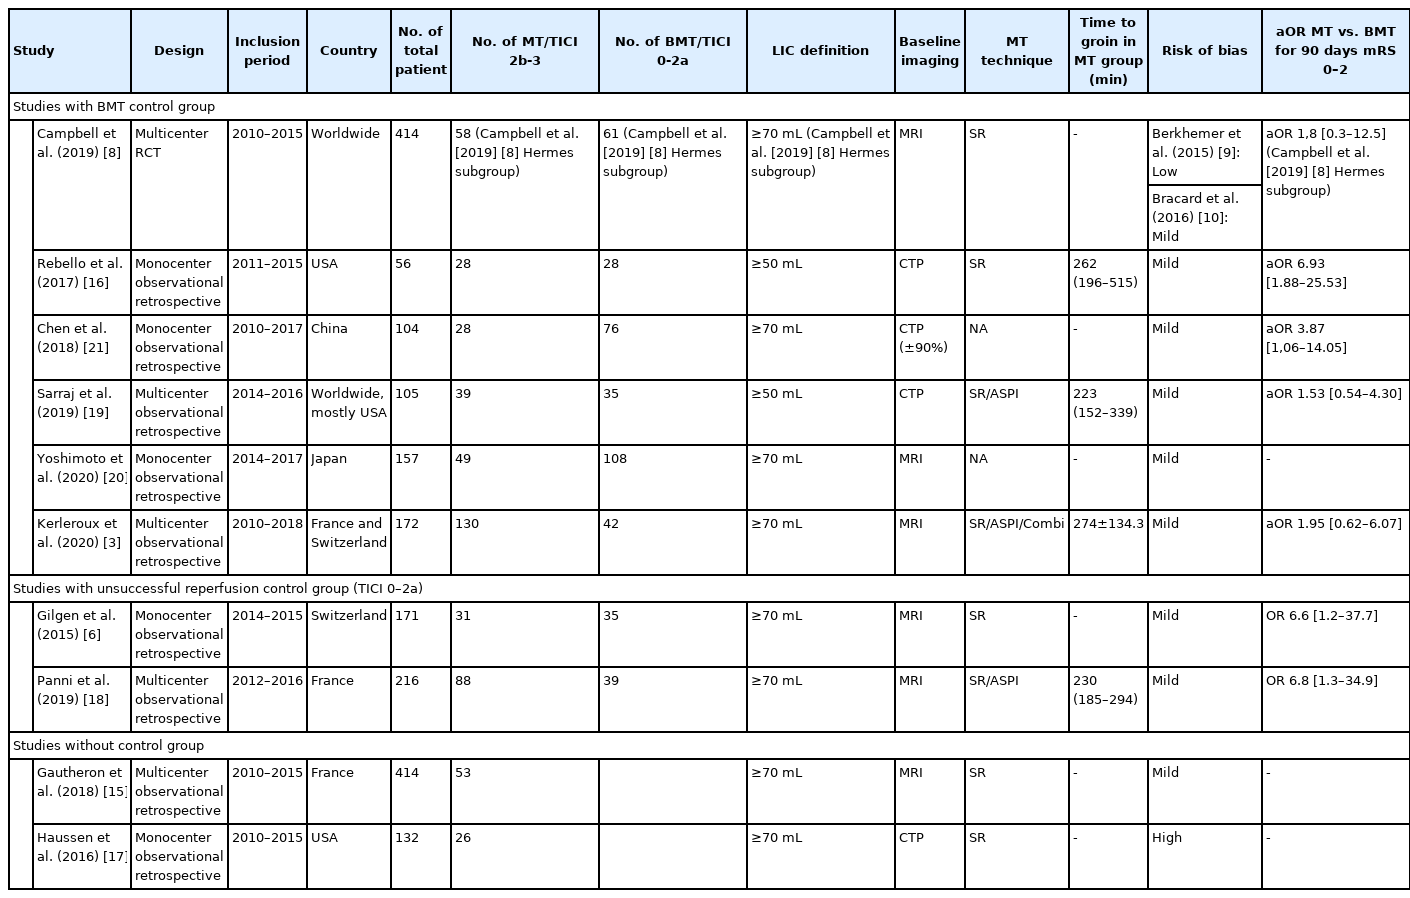
Characteristics of included studies
Study inclusion periods ranged 2015 to 2020, two studies were international, two studies were from the USA, three from France, one from China, Japan, and Switzerland. Five studies (71.5%) were from a single center, and six (85.7%) reported a prospective enrolment. Amongst the included studies, six [3,8,16,19-21] totalizing 682 patients had control groups treated with BMT alone, allowing to compare 332 patients who received MT to 350 who received BMT only. Four studies [3,6,15,18] used only MRI, two [8,20] over 90% of MRI and were merged with the MRI group. Three [16,17,19] used only CTP and one [21] over 90% of CTP and was merged with the CTP group.
Quality of included studies and risk of bias
There are 11 studies in the quality and risk of bias section because we assessed the risk of bias of both RCTs [9,10] included in the Meta-analysis by Campbell et al. [8], individually with the appropriate RoB-2 tool [11]. Ten of 11 (90%) studies [3,6,9,10,15,16,18-21] were rated as high-quality study based on the Ottawa Newcastle scale. Using the modified STROBE checklist, all studies had good reporting [3,6,9,10,15-19,21], and none were rated as poor, inadequate, or acceptable. Risk of bias was assessed as low in 1/11 (9%) [8], mild in 9/11 (81.81%) [3,6,15,16,18-21], and high in 1/11 (9%) [22], studies.
Rates of unfavorable outcome, sICH and mortality in patients treated with MT
Overall, the rate of patients with mRS 3–6 at 90 day was 74% (99% CI, 67 to 84; Z-value=7.04; I2=92.3%) (Figure 2). Funnel plot inspection (Supplementary Figure 1), followed by Egger’s regression test excluded publication bias (2-tailed P=0.85). To gauge the impact of each study, we ran sensitivity analysis, computing the summary effect of each study exclusion (Supplementary Figure 2). Meta-regression did not identify a significant variation across publication dates (Supplementary Figure 3).
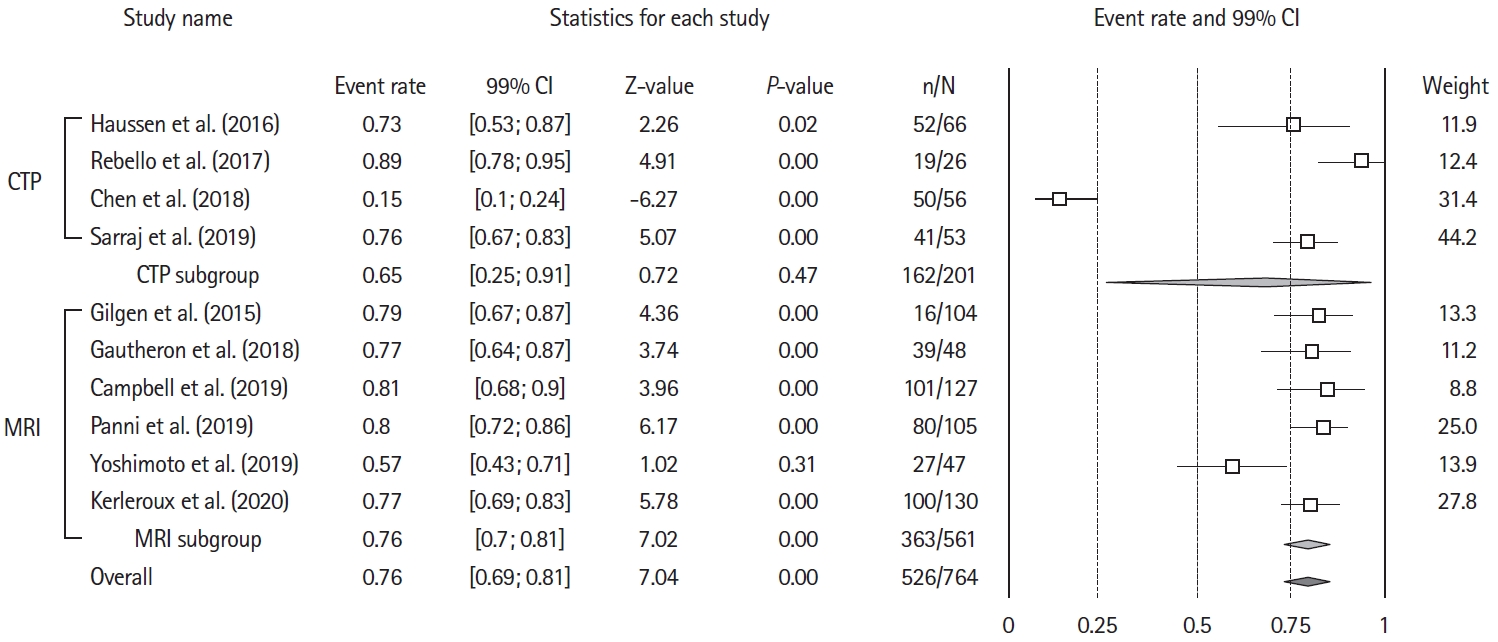
Forest plot for the rates of patients with 90-day unfavorable outcome after mechanical thrombectomy. Unfavorable outcome=modified Rankin Scale (mRS) of 3 or more at 90-day. CI, confidence interval; CTP, computed tomography-perfusion; MRI, magnetic resonance imaging.
Six studies provided baseline core volumes [3,15,16,18-21], analyzed as a moderator variable in meta-regression. Mean baseline core volumes had no measurable significant effect on the proportion of poor outcomes (coefficient=–0.01; standard error, 0.03; Z-value=–0.38; P=0.7) (Supplementary Figure 4). The proportion of patients with poor outcome did not differ significantly in the two studies defining LIC as >50 mL [16,19] 80% (99% CI, 67 to 83; Z-value=6.78; I2=73.89) versus the 8 defining LIC as >70 mL [3,6,8,15,17,18,20,21]
Similarly, there was no difference in the proportion of patients achieving poor outcome when selected with MRI (six studies) 76% (99% CI, 70 to 81; Z-value=7.02; I 2=51.9 [3,6,8,15,18]); or CTP (four studies) 75% (99% CI, 25 to 91; Z-value=0.72; I2=96.62 [16,17,19,21]; P for heterogeneity between groups=0.56) (Supplementary Figure 5). Nine studies [3,6,15-21] provided data on 90-day mortality, that occurred in 250 of 714 patients (event rate, 36%; 99% CI, 33 to 40; Z-value=–7.07; I2=74.5) (Supplementary Figure 6). sICH data was available from eight studies [3,6,8,15,18,19,21], and reported in 88/680 patients (event rate, 14%; 99% CI, 12 to 17; Z-value=–15.48; I2=57.4).
MT effect meta-analysis
Unfavorable outcome
Six studies [3,8,19-21] included a control group allowing to assess the effect of MT versus BMT alone. Two additional studies [6,18] provided crude numbers of outcome for patients who received MT with successfully (thrombolysis in cerebral infarction [TICI] 2b-3) versus unsuccessfully (TICI 0-2a) recanalized, and were included in sensitivity analyses (Table 2).

Categorial outcomes (studies with MT vs. BMT design only)
A total of 332 and 350 patients received MT+BMT and BMT alone, respectively. Receiving MT was associated with a significant decrease in unfavorable outcome (pooled odds ratio [OR], 0.19; 99% CI, 0.11 to 0.33; P<0.01; Z-value=–5.92; I2=62.56). This effect was consistent in sensitivity analyses when adding studies with successful versus unsuccessful reperfusion (Figure 3). MT effect on functional independence was similar between studies using MRI or CTP (Supplementary Figure 7), or according to LIC definition (>50 or >70 mL) (Supplementary Figure 8).
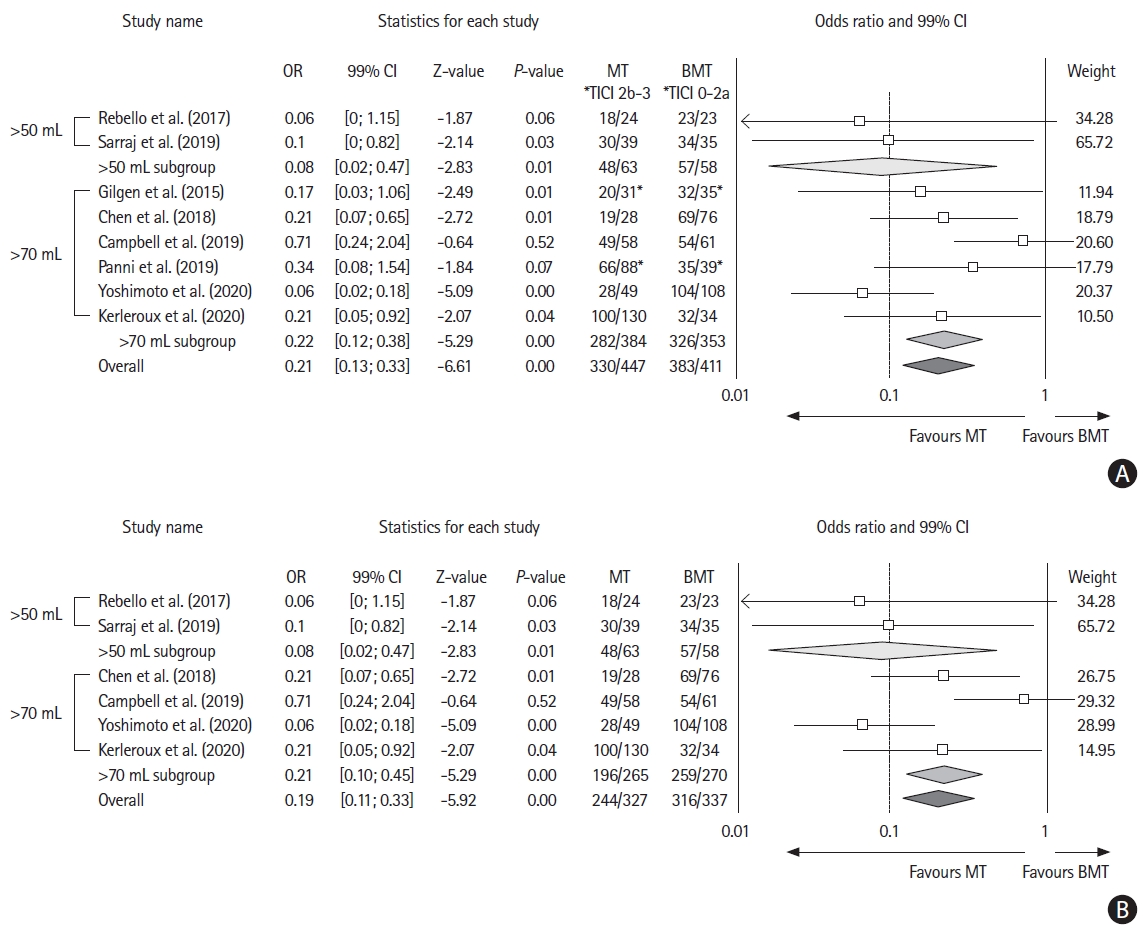
Forest plot showing the effect on 90-day unfavorable outcome (modified Rankin Scale of 3 or more) of (A) mechanical thrombectomy (MT) vs. best medical treatment (BMT) and (B) MT vs. BMT without considering reperfusion status. OR, odds ratio; CI, confidence interval. *Considering successful reperfusion (thrombolysis in cerebral infarction [TICI] 2b-3) vs. unsuccessful reperfusion (TICI 0-2a).
Of note, there was no difference in aggregate OR when comparing subgroups of patients per recanalization status, versus per treatment arm (P for the between groups difference=0.84). Six studies [3,8,16,19-21] provided adjusted odds ratio (aOR) for the rates of favorable outcomes in patients receiving MT. The aggregated aOR for favorable outcome in patients treated with MT+BMT versus BMT was 5.99 (99% CI, 3.17 to 11.33; Z-value=7.23). All individual aOR were adjusted for baseline core volume (Supplementary Figures 9 and 10).
Mortality and sICH
Five studies [3,8,19-21] provided comparative data on sICH in patients treated with BMT with or without MT. There was no difference between treatment groups in sICH (OR, 0.96; 99% CI, 0.2 to 1.49; P=0.54; Z-value=–0.63; I2=64.74) (Supplementary Figure 11). MT was associated with a lower aggregate probability for mortality (OR, 0.60; 99% CI, 0.34 to 1.06; P=0.02; Z-value=–2.30; I2=58.72) (Supplementary Figure 12).
Discussion
In this meta-analysis of current data we showed (1) that the rates of unfavorable outcome following thrombectomy in patients with a quantitatively assessed LIC volume at baseline was 74%, and that (2) MT was a strong outcome modifier, reducing the odds of unfavorable outcome by a factor 5 in this population (OR, 0.19). The analysis of secondary endpoints demonstrated that the rates of mortality and sICH were 36%, and 14% respectively. MT was associated with decreased odds for mortality (OR, 0.60), but did not influence sICH incidence in our analysis.
These updated data reinforce the results of a previous analyses of the effect of MT in patients with low ASPECTS [4,23], by providing up-to-date estimates of the outcomes of patients after MT despite a large baseline ischemic core assessed volumetrically.
In a previous meta-analysis, Cagnazzo et al. [4] found MT to be associated with higher odds of favorable 3 months outcome in patients with low ASPECTS (OR, 4.76; 31/149 vs. 10/184; 99% CI, 1.3 to 16.8; I2=31%; P=0.01). Yet, as the clinical-imaging selection framework for MT evolves with imaging software technological advances and the advent of individualized decision making, there’s a need for quantitative biomarkers to identify patients with LIC who may benefit from MT. ASPECTS is a universally used semi-quantitative scale to assess for ischemic core extent, and has fair accuracy when compared to CTP or DWI [24]. ASPECTS assessed on DWI has further been shown to correlate with DWI segmented ischemic core volume [25], but with decreasing performances in patients with an ASPECTS of 4 or less. Furthermore, the optimal ASPECTS cut-off found to discriminate accurately patients with ischemic cores over 70 mL, has been shown to be quite consistently around 4 [20,25].
Yet in patients with ASPECTS of 4 or less (hence with ischemic cores over 70 mL), the effect of MT remains uncertain. In the work by Cagnazzo et al. [4], patients with very low ASPECTS (0–4) had a good outcome rate of 17.1% (86/461; 99% CI, 12.3 to 21.9; I2=37.6%), which is of similar magnitude to that found in our analysis of patients with LICs volume, although there was considerable heterogeneity in this outcome aggregation (I2=92.3). The use of volumetric approaches has been facilitated by the development of multiple dedicated post-processing softwares [5], prompting the need for a comprehensive analysis of the outcome of these patients after MT, and a comparison to the outcomes of patients with BMT alone. Patients with LICs volume were underrepresented in trials that validated MT in the early therapeutic window [26], and more recently in the extended window (Thrombectomy 6 to 24 Hours after Stroke with a Mismatch between Deficit and Infarct [DAWN] excluded patients with ischemic cores over 50 mL [27], and Thrombectomy for Stroke at 6 to 16 Hours with Selection by Perfusion Imaging [DEFUSE 3] [28], over 70 mL), precluding to draw strong conclusions in these subgroups.
Accumulating evidence suggests for a benefit of MT in patients with LIC volumes, and until the results of ongoing dedicated trials such as Exploration of the limits of MT indications in a single action–Large Stroke Therapy Evaluation (IN EXTREMIS–LASTE, NCT03811769), Efficacy and Safety of Thrombectomy in Stroke With Extended Lesion and Extended Time Window (TENSION, NCT03094715), Thrombectomy for Emergent Salvage of Large Anterior Circulation Ischemic Stroke (TESLA, NCT03805308), and A Randomized Controlled Trial to Optimize Patient's Selection for Endovascular Treatment in Acute Ischemic Stroke (SELECT 2, NCT03876457) become available, the community faces a challenge in the treatment strategy for this subgroup.
In our analysis, there was no detectable difference in the pooled outcome of patients according to large volume definition (50 mL vs. 70 mL in included studies), suggesting that MT may be beneficial in high ranges of baseline core volumes. Refining selection process may include the evaluation of the extent of still salvageable tissue (i.e., penumbra), as has been recently suggested in a dedicated analysis of the role of perfusion imaging to better select patients for MT [3]. In this analysis, the authors demonstrated that implementing penumbral imaging in the framework of patients selection, allowed to treat a larger pool of patients deemed likely to benefit from MT, despite being ineligible as per current guidelines [1,29].
We demonstrated substantial statistical heterogeneity for the aggregated estimates of poor clinical outcomes, and moderate heterogeneity for mortality and sICH analyses. This heterogeneity, in part, is likely derived from the differences in pooled studies including variations in basic design, settings, selection of patients in each comparison group, and unmeasured confounders. For example, despite the exclusion of studies using older generation devices for MT, the rate of successful reperfusion remains variable across studies (e.g., Gilgen et al. [2015] [6], TICI 2b-3=47% vs. Panni et al. [2019] [18], TICI 2b-3=69%) and could in turn, contribute to the heterogeneity of current analyses. Since data presentation was not uniform among source papers, we were unable to adjust our analysis for important aspects such as recanalization statuses, level of care stratification, withdrawal of care decisions and other potential confounders that may have influenced results. Moreover, in the absence of high-level evidence for standard management of the subgroup of patients with LIC at baseline, there may be considerable variation in the management of such situations, determined by unaccounted confounders such as pre-stroke functional status, and unreported comorbidities.
We aimed at minimizing this bias by conducting a pooled analysis of aORs presented in six studies, that showed consistence with the unadjusted analyses. Our rationale was to include the totality of most up-to-date evidence on the topic according to state-of-the-art meta-analysis methods and increase the sample size for overall rare outcomes. We acknowledge that this approach might introduce further heterogeneity in our estimates and is a potential limitation. The majority of data were derived from single center studies (71.5% of included samples), and only one reports results from randomized controlled trials. Quite reassuringly, in all analyses estimates seemed to be consistent from study to study.
Conclusions
The current pooled analysis of up-to-date data suggests benefit of MT, in addition to BMT alone, in AIS patients that present with a LIC, assessed volumetrically. The overall severe prognosis prompts caution when discussing outcomes with providers and families. Ongoing and future large clinical trials and observational studies and then, their meta-analysis, including individual patient data meta-analyses are needed to validate these results.
Supplementary materials
Supplementary materials related to this article can be found online at https://doi.org/10.5853/jos.2021.00724.
Risk of bias of each individual non-randomised study according to the ROBINS-I Cochrane Collaboration tool
Risk of bias of each individual randomised study according to the ROB-2 Cochrane Collaboration tool
Quality measure of included studies by the Newcastle-Ottawa quality assessment scale
Quality measure of included studies inspired by the Strengthening the Reporting of Observational Studies in Epidemiology (STROBE) statement’s checklist
Funnel plot for aggregate proportion of unfavorable outcome. Each dot represents a study; the y-axis represents the size of the study (e.g., number of subjects) and the x-axis shows the result of the study (e.g., the intervention’s measured average effect). Asymmetric funnel plot suggesting a relationship between treatment effect and study size.
One study removed analysis. This forest plot displays the summary values computed when that row’s study is removed from the meta-analysis. Unfavorable outcome=modified Rankin Scale of 3 or more at day 90. CI, confidence interval. *P-value for heterogeneity.
Regression analysis of publication date. Meta regression is an extension to aggregated estimates, that assesses the extent of heterogeneity related to study-specific variables. This bubble plot is a visual representation of the fitted regression line with circles representing the estimates from each study, sized according to the precision of each estimate. Circles that diverge from the regression translate to important heterogeneity, and the inclination of the fitted line provides a visual representation of the effect of the studied variable on the estimates, here publication date.
Meta regression of unfavorable outcome according to reported study mean infarct core volumes. Meta regression is an extension to aggregated estimates, that assesses the extent of heterogeneity related to study-specific variables. This bubble plot is a visual representation of the fitted regression line with circles representing the estimates from each study, sized according to the precision of each estimate. Circles that diverge from the regression translate to important heterogeneity, and the inclination of the fitted line provides a visual representation of the effect of the studied variable on the estimates, here mean core volume in each study.
Forest plot of the rates of patients with 90-day unfavorable outcome after mechanical thrombectomy with subgroup analysis per study imaging selection modality. Unfavorable outcome=modified Rankin Scale of 3 or more at day 90. CI, confidence interval; CTP, computed tomographyperfusion; MRI, magnetic resonance imaging. *P-value for heterogeneity.
Forest plot for the rates of 90-day mortality. CI, confidence interval. *P-value for heterogeneity.
(A) Forest plot showing the effect of mechanical thrombectomy (MT) vs. best medical treatment (BMT) on 90-day unfavorable outcome, with subgroup analysis per imaging modality (computed tomography-perfusion [CTP]/magnetic resonance imaging [MRI]). (B) Forest plot including studies with successful (thrombolysis in cerebral infarction [TICI] 2b-3) vs. unsuccessful (TICI 0-2a) reperfusion. Unfavorable outcome=modified Rankin Scale of 3 or more at day 90. OR, odds ratio; CI, confidence interval. *Or successful vs. unsuccessful reperfusion.
Forest plot showing the effect of mechanical thrombectomy (MT) vs. best medical treatment (BMT) on 90-day unfavorable outcome with subgroup analysis per large infarct volume definition (>50/70 mL). (B) Forest plot including studies with successful (thrombolysis in cerebral infarction [TICI] 2b-3) vs. unsuccessful (TICI 0-2a) reperfusion. Unfavorable outcome=modified Rankin Scale of 3 or more at day 90. OR, odds ratio; CI, confidence interval. *Or successful vs. unsuccessful reperfusion.
Forest plot of mechanical thrombectomy (MT) effect on 90-day favorable outcome, using pooled adjusted odds ratio (OR). Favorable outcome=modified Rankin Scale of 2 or less at day 90. CI, confidence interval; BMT, best medical treatment.
Funnel plot for adjusted odds ratio of favorable functional outcome. Each dot represents a study; the y-axis represents the size of the study (e.g., number of subjects) and the x-axis shows the result of the study (e.g., the intervention’s measured average effect). Asymmetric funnel plot suggesting a relationship between treatment effect and study size. Favorable outcome=modified Rankin Scale of 2 or less at day 90.
(A) Forest plot showing the effect of mechanical thrombectomy (MT) vs. best medical treatment (BMT) on symptomatic intracranial hemorrhage (sICH). (B) Forest plot including studies with successful (thrombolysis in cerebral infarction [TICI] 2b-3) vs. unsuccessful (TICI 0-2a) reperfusion. OR, odds ratio; CI, confidence interval. *Or successful vs. unsuccessful reperfusion.
(A) Forest plot showing the effect of mechanical thrombectomy (MT) vs. best medical treatment (BMT) on 90-day mortality. (B) Forest plot including studies with successful (thrombolysis in cerebral infarction [TICI] 2b-3) vs. unsuccessful (TICI 0-2a) reperfusion. OR, odds ratio; CI, confidence interval. *Or successful vs. unsuccessful reperfusion.
Notes
Disclosure
The authors have no financial conflicts of interest.