Calcium Intake and Serum Calcium Level in Relation to the Risk of Ischemic Stroke: Findings from the REGARDS Study
Article information
Abstract
Background and Purpose
Data on the association between calcium (Ca) and ischemic stroke are sparse and inconsistent. This study aimed to examine Ca intake and serum Ca levels in relation to risk of ischemic stroke.
Methods
The primary analysis included 19,553 participants from the Reasons for Geographic And Racial Differences in Stroke (REGARDS) study. A subcohort was randomly selected to create a case-cohort study (n=3,016), in which serum Ca levels were measured. Ischemic stroke cases were centrally adjudicated by physicians based on medical records. Cox proportional hazards regression for the cohort and weighted Cox proportional hazard regression with robust sandwich estimation method for the case-cohort analysis with adjustment for potential confounders were performed.
Results
During a mean 8.3-year follow-up, 808 incident cases of ischemic stroke were documented. Comparing the highest quintile to the lowest, a statistically significant inverse association was observed between total Ca intake and risk of ischemic stroke (hazard ratio [HR], 0.72; 95% confidence interval [CI], 0.55 to 0.95; Plinear-trend=0.183); a restricted cubic spline analysis indicated a threshold effect like non-linear association of total Ca intake with ischemic stroke (Pnon-linear=0.006). In the case-cohort, serum Ca was inversely associated with the risk of ischemic stroke. Compared to the lowest, the highest quintile of serum Ca had a 27% lower risk of ischemic stroke (HR, 0.73; 95% CI, 0.53 to 0.99; Plinear-trend=0.013). Observed associations were mainly mediated by type 2 diabetes, hypertension, and cholesterol.
Conclusions
These findings suggest that serum Ca has inverse and Ca intake has threshold effect like association with risk of ischemic stroke.
Introduction
Because of its favorable effects on blood pressure [1,2], hypertension [3,4], type 2 diabetes [5], insulin resistance [6], and metabolic syndrome [7], calcium (Ca) may play an important role in the prevention of ischemic stroke. Results from meta-analyses of studies exploring the association between dietary Ca intake and the risk of ischemic stroke are inconsistent but suggest a non-linear trend [8,9]. In 2013, a dose-response meta-analysis demonstrated an inverse association between dietary Ca intake and ischemic stroke risk in participants with low Ca intake (i.e., <700 mg/day), but a positive borderline association between Ca intake and the risk of ischemic stroke in participants with >700 mg/day [8]. A more recent meta-analysis of 10 cohort studies found no association between dietary Ca intake and total stroke or stroke subtypes but predicted a non-linear association between dietary Ca intake and the risk of total stroke [9]. However, the study found those with high Ca intake from dairy sources and those with longer follow-up period (≥14 years) had reduced risk of total stroke.
Although bioavailability of Ca intake is always a concern, studies on the association between serum Ca and the risk of ischemic stroke are sparse. In a prospective study, serum Ca was associated with increased risk of ischemic stroke [10]. Moreover, a meta-analysis of three cohort studies reported a direct association between circulating Ca levels and risk of total stroke [11].
There is a growing concern about the role of Ca intake at high levels in elevating the risk of heart diseases and stroke [12-15]. Nonetheless, no prospective cohort study has examined both Ca intake and serum Ca levels in relation to the risk of ischemic stroke in the same study. In the present study, we aimed to investigate the association of Ca intake and serum Ca level with the risk of ischemic stroke. In addition, we aimed to investigate whether any observed association was modified by sex, race, and region using data from the Reasons for Geographic And Racial Differences in Stroke (REGARDS) study.
Methods
The REGARDS study is a longitudinal population-based study among blacks and whites designed to investigate risk factors associated with excess stroke mortality in the USA among blacks and residents of the Stroke Belt region [16]. The prospective participants in the REGARDS study were randomly selected from commercially available nationwide lists purchased through GeneSys, Inc. (Daly City, CA, USA) [17]. Prospective participants were sent letters by mail to introduce the study, and then they were contacted by telephone for recruitment between January 2003 and October 2007. Demographic data were collected using computerassisted telephone interviews after initial verbal consent. During the subsequent baseline home visits, written informed consents were obtained and dietary and behavioral data were collected by self-administered questionnaires. Physical measurements including weight, height, and cardiovascular health profile (electrocardiography and blood pressures) were recorded and blood samples were collected during baseline first home visits. The REGARDS cohort has been described in more detail elsewhere [16,18]. Of the initially recruited 30,239 participants, 10,509 participants were excluded due to missing data on dietary intake, income, stroke history, or other covariates. Additionally, we excluded 177 participants (n=90 incident hemorrhagic stroke cases, n=87 unidentified stroke cases) leaving 19,553 participants for the cohort analysis (Figure 1). None of the participants had an implausible value for total energy intake (<500 kcal/day or >5,000 kcal/day [19]) in the data included in this study.

Study participants’ selection process in cohort analysis. REGARDS, Reasons for Geographic And Racial Differences in Stroke.
We also conducted a case-cohort analysis investigating the association of serum Ca levels with the risk of ischemic stroke. The subcohort was randomly selected from the REGARDS cohort using stratified random sampling from each stratum jointly classified by age, sex, race, and region with an overall sampling probability of 9%, and all incident stroke cases were included (n=730). In the case-cohort analysis, a total of 3,016 participants (with 730 incident ischemic stroke cases, 86 of which were in the random subcohort) that had data for serum Ca were included after excluding those with non-ischemic stroke cases (n=55 hemorrhagic stroke), and those with missing values in key covariates (n=293) (Figure 2). The final weighted effective sample size for the case-cohort was 3,102. The REGARDS study was approved by Institutional Review Boards (IRB) of each participating institution, and the present study was approved by the IRB for Indiana University, Bloomington.
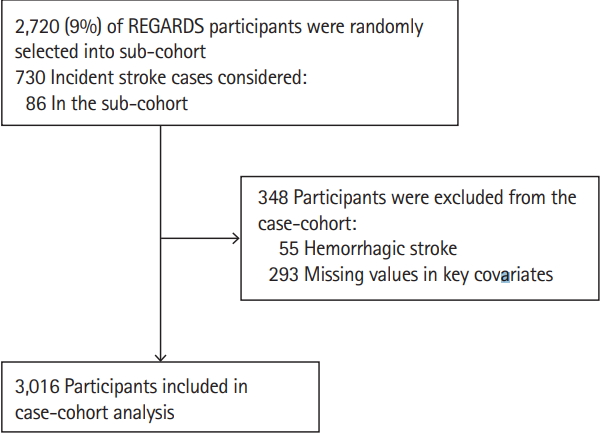
Study participants’ selection process in case-cohort analysis. REGARDS, Reasons for Geographic And Racial Differences in Stroke.
Exposure measurement
Dietary intake data were collected using a self-administered modified Block 98 food frequency questionnaire (FFQ) that had over 150 multiple choice questions about 107 food items [18,20,21]. The FFQ asked the frequency and amount of intake of each food item per day over the past 1 year at baseline. Nutrients in foods were extracted by NutritionQuest (Berkeley, CA, USA) using the Block nutrient database that was developed based on the United States Department of Agriculture Nutrient Database for Standard References [22]. The amount of each food consumed was calculated by multiplying the reported frequency by the portion size for each food item. The total amount of a nutrient contributed from each food was derived by multiplying the amount consumed by the amount of the nutrient in the given FFQ line item. Nutrients were summed over all FFQ food items to provide estimates for total daily nutrient intake. The Block FFQ had been validated for the assessment of nutrients including Ca with a correlation coefficient greater than 0.6 for Ca between Block FFQ and multiple-day 24-hour recall [23,24]. Total (dietary plus supplementation) and dietary (from food only) Ca intake were reported as milligram per day (mg/day). Supplemental Ca intake was assessed through identification in a medication inventory whereby the participants showed a trained health professional any medication they used at least once in the 2 weeks prior to the first in-home visit, and then Ca was estimated from actual Ca supplements, multivitamins or Ca-containing medications.
A blood sample was collected using standard phlebotomy during the first home visit at baseline. Among participants included in the case-cohort study, serum Ca was measured using an automated enzyme colorimetric assay on the Roche Integra instrument (Roche Diagnostics, Indianapolis, IN, USA). The assay range was 0.4 to 100 mg/dL. Inter-assay coefficients of variation ranged from 1.88% to 2.82%.
Outcome ascertainment
The REGARDS study participants were followed every 6 months via telephone for stroke events and to obtain the reason for hospitalization if a participant was hospitalized. Medical records were obtained and evaluated if the participant reported seeking medical care for stroke events, transient ischemic attack, or death [25]. Once the medical record was received for a stroke event, a team of physicians verified and subtyped the stroke event as ischemic or hemorrhagic [25,26]. Ischemic stroke was defined according to the World Health Organization [27] as sudden focal, at times global neurological deficits lasting >24 hours with signs and symptoms corresponding to the involvement of focal areas of the brain or as a non-focal neurological deficit with imaging consistent with that of ischemic stroke [16,28].
Covariates
Data collected using computer-assisted telephone interview included age (continuous), sex (female/male), race (black/white), regions, body mass index (BMI), socioeconomic status (education and income), regular aspirin use (yes or no), smoking, alcohol intake, food intake, and physical activity level. Region was categorized into non-Belt, Stroke Belt (Alabama, Arkansas, Georgia, Louisiana, Mississippi, North Carolina, South Carolina, and Tennessee), or Stroke-Buckle (coastal plains in Georgia, North Carolina, and South Carolina with high stroke mortality) [29]. Sex was self-reported. Education was categorized to less than high school, high school, some college, and college plus. Annual income was categorized to <20, 20 to 34, 35 to 74, and ≥75 USD. BMI was derived from weight in kg divided by height in meters squared. Alcohol use was categorized into three levels based on drinks per week, either none, moderate (0 to 7 drinks/week in women, 0 to 14 drinks/week in men), or heavy (>7 drinks/week in women, >14 drinks/week in men). Smoking was categorized as never smoker, former smoker, or current smoker. Exercise was categorized into three levels based on the frequency of physical activity per week (none, 1 to 3 times, or 4 or more times). Two blood pressure measurements were taken using aneroid sphygmomanometer during home visits and the mean of the two measurements was recorded. Total calorie intake and vitamin D intake were generated from the FFQ. Other covariates including total cholesterol, high density lipoprotein (HDL), and low density lipoprotein (LDL), and blood glucose levels were measured from the blood sample taken during the baseline in-home visit by colorimetric reflectance spectrophotometry using the Ortho Vitros Clinical Chemistry System 950IRC instrument (Johnson & Johnson Clinical Diagnostics, New Brunswick, NJ, USA) [18]. Serum 25-hydroxyvitamin D [25(OH)D] in ng/mL) was generated from an ancillary study to adjust for in sensitivity analysis in the case-cohort analysis. Because Ca and magnesium (Mg) compete for intestinal absorption and renal reabsorption, we also adjusted for Mg intake in the cohort and serum Mg in the case-cohort models [30,31].
Statistical analysis
Analysis of variance (ANOVA; for normally distributed continuous variables), and Kruskal-Wallis test (for non-normally distributed continuous variables and for ordinal variables) were used to compare covariates across Ca quintiles. We used the chi-square test to compare the distribution of categorical variables across Ca quintiles.
We compared the risk of ischemic stroke by the levels of total, dietary, and supplemental Ca intake using Cox proportional hazards regression models adjusted for covariates in a sequential manner: model 1 included the exposure of interest, age, sex, race, BMI, region and the interaction of age and race. Model 2 additionally adjusted for education, income, smoking, alcohol consumption, and exercise. Model 3 further adjusted for total energy intake, regular aspirin use, and total Mg intake. The model on dietary Ca intake was adjusted for supplemental Ca intake, and the model on supplemental Ca intake was adjusted for dietary Ca intake, respectively. Model 4 was further adjusted for HDL, and vitamin D intake. Ca was categorized in quintiles in the analyses. To assess trend across quintiles of Ca, the median of each quintile, as a continuous variable, was included in the models. We also examined non-linear associations between Ca and the risk of ischemic stroke non-parametrically with restricted cubic spline analyses [32]. In the cubic spline analysis, we used the median of the first quintile of Ca as the reference and 4 knots. For supplemental Ca intake we used 50 mg/day as the reference category; participants in the first quintile of supplemental Ca did not consume a Ca supplement.
We further conducted a stratified analysis to determine whether there was a difference in the associations by sex, race, and region. Interactions between variables in the models were considered significant at P-values ≤0.1. We examined whether hypertension, systolic blood pressure (SBP), fasting blood glucose (FBG), type 2 diabetes, total cholesterol, HDL, LDL, or triglyceride mediated the potential association between Ca and ischemic stroke each at a time using the method described by Hertzmark et al. (2012) [33]. This method calculates the proportion mediated as percent mediated =
For the case-cohort analysis, we used a weighted multivariable Cox proportional hazards regression to compute the parameters and robust variance estimates. We weighted noncase subcohort by the inverse of subcohort sampling fraction. Case subcohort was assigned a weight equal to the inverse of subcohort sampling fraction up to shortly before the failure time and a weight equal to 1 from that point to failure time. The non-subcohort cases were assigned a weight of 1 and entered the risk set shortly before failure time [35]. This analysis was based on the method provided by Barlow et al. [36] that has been explained in detail by Kulathinal et al. [35]
The proportional hazard regression assumptions were tested by plotting the cumulative martingale residuals against the variable of interest and using the Supremum test. We considered P values ≤0.05 statistically significant if not otherwise specified. We conducted all the statistical analyses in SAS version 9.4 (SAS Institute Inc., Cary, NC, USA).
Data availability
Any reasonable request for the REGARDS datasets used in this study should be submitted to the REGARDS Publication and Presentation Subcommittee via http://www.regardsstudy.org and the datasets are available upon approval.
Results
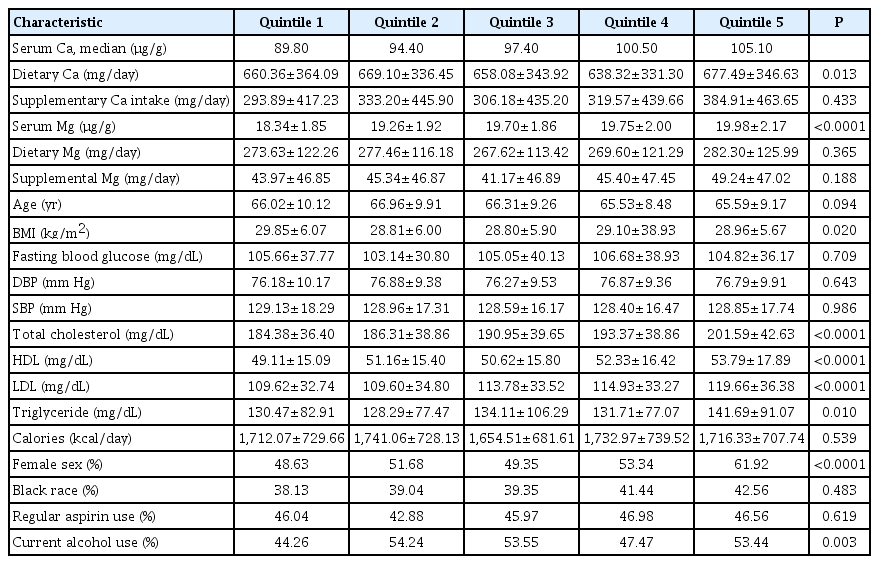
During a mean follow-up of 8.3-year (standard deviation: 3.2), 808 incident cases of ischemic stroke were observed in the cohort. At baseline, participants with higher total Ca intake were more likely to be older, non-smokers, more likely to have lower BMI. Participants with high total Ca had lower diastolic blood pressure and SBP, were less likely to have type 2 diabetes, were more likely to consume alcohol at moderate levels, exercise 4 or more times per week, and have used Ca and Mg supplements and aspirin regularly (P<0.05) (Table 1).

Baseline characteristics of participants in the cohort by quintiles of total Ca intakes: the REGARDS study (n=19,553)
When comparing the highest quintile to the lowest quintile of total Ca intake, total Ca was significantly inversely associated with ischemic stroke (hazard ratio [HR], 0.72; 95% confidence interval [CI], 0.55 to 0.95; Plinear-trend=0.183) (Table 2). In contrast, the restricted cubic spline analysis indicated a non-linear association between total Ca intake and ischemic stroke (P for nonlinear trend=0.006) (Figure 3). Both results suggest a threshold effect of Ca on the risk of ischemic stroke. When comparing the highest quintile to the lowest, dietary Ca was not linearly associated with the risk of ischemic stroke (Table 2). A borderline non-linear association was also observed for dietary Ca intake (P for non-linear trend=0.053) (Supplementary Figure 1). In sensitivity analyses using the quartiles and tertiles of total and dietary Ca, the results remained (data not shown).

The HR (95% CI) of ischemic stroke by quintiles of Ca intake in the REGARDS cohort (n=19,553)

Restricted cubic spline analysis of the association between total calcium (Ca) intake and the risk of ischemic stroke (n=19,553). The middle solid line indicates the point estimates of hazard ratios and the broken lines indicate the lower and upper limits of the corresponding 95% confidence intervals. The horizontal broken line is at hazard ratio=1. Four knots were used for the analysis. In the restricted cubic spline analysis, a significant non-linear association was observed (P for non-linearity=0.006).
In a mediation analysis, the observed association between total Ca intake and ischemic stroke was mainly mediated through FBG (proportion of association mediated [PAM]: 19.6%, P=0.0002), type 2 diabetes (PAM: 9%, P=0.017), SBP (PAM: 12%, P=0.017), hypertension (PAM: 8.0%, P=0.014), total cholesterol (PAM: 9.6%, P=0.005), and HDL (PAM: 9.5%, P=0.005) (Supplementary Table 1).
Supplemental Ca intake was not significantly linearly associated with the risk of ischemic stroke (HR, 1.03; 95% CI, 0.80 to 1.32; P=0.449) (Table 2). Restricted cubic spline analysis indicated a significant non-linear association between Ca supplement and the risk of ischemic stroke (P=0.034) (Supplementary Figure 2). Using those without supplemental Ca intake as a reference, the non-linear association remained (data not shown).
In the case-cohort, those in the highest quintile of serum Ca consumed higher amounts of dietary Ca, had higher serum Mg, and had higher total cholesterol, higher LDL, higher triglycerides, and higher HDL; were more likely to be female and currently drink alcohol as compared to those in the lowest quartile of serum Ca (P<0.05) (Table 3). An inverse association of serum Ca levels with ischemic stroke in the case-cohort analysis was observed (HR, 0.73; 95% CI, 0.53 to 0.99; P=0.013) when comparing the highest to the lowest quintile (Table 4). In a sensitivity analysis, further adjusting SBP and type 2 diabetes in the final model, the result remained (HR, 0.71; 95% CI, 0.51 to 0.99; P=0.016). In a sensitivity analysis using data with a reduced sample size (n=1,601, event=602), adjusting for serum 25(OH)D, the association disappeared (HR, 0.84; 95% CI, 0.57 to 1.24; P=0.568). Of note, serum 25(OH)D was not significant in the model (P=0.887).
Baseline characteristics of participants in the case-cohort by quintiles of serum Ca: the REGARDS study (weighted, n=3,102)

The HR (95% CI) of ischemic stroke by quintiles of serum Ca in the case-cohort analysis (weighted, n=3,102)
The interactions between sex, race or region and Ca in the models were not statistically significant at alpha=0.1.
Discussion
In this large prospective cohort study, we observed a threshold effect like non-linear inverse association of Ca intake and an inverse linear association of serum Ca levels with the risk of ischemic stroke, independent of potential confounding variables. These associations were mainly mediated through diabetes, hypertension, and cholesterol.
Our results are consistent with the findings of two metaanalyses that suggested Ca intake is non-linearly associated with the risk of stroke [8,9]. In the Larsson et al. (2013) [8] metaanalysis, they observed in those with <700 mg/day mean Ca intake, the risk of ischemic stroke was lower by 16% for every 300 mg/day increase in Ca intake while in those with >700 mg/day mean Ca intake, the risk of ischemic stroke was higher by 3%. In the same study, the authors stated that Ca has a beneficial effect in Asian populations with low to moderate Ca intake but not in American or European populations with high Ca intakes. The studies with mean Ca intake >700 mg/day were mostly European with only one American study. None of the individual studies in the Larsson meta-analysis with mean Ca intake >700 mg/day found a significant association. Of note, the sample sizes in all the studies included in the Larsson et al. [8] meta-analysis were small. Unlike previous studies that suggested the possible benefit of dietary Ca in reducing the risk of stroke is observed only among the Asian populations with low to moderate Ca intake, we observed inverse or non-linear inverse associations between Ca and ischemic stroke in Americans. In the Tian et al. (2015) [9] updated meta-analysis, the authors reported an inverse association in the studies with a long duration of follow-up (≥14 years) and in the studies with dairy Ca sources. They did not find a significant association in short duration studies and studies with non-dairy sources of Ca, but the overall pooled result showed a significant inverse association. The difference between our study and the other studies in the meta-analysis might be due to differences in study population (in our case, participants from stroke belt region and Black participants were oversampled); the other potential reasons might be due to differences in adjusted variables. As hypertension and type 2 diabetes were on the path of association, we did not adjust them. The Tian et al. [9] study hypothesized that the role of Ca in stroke might be due to the beneficial effect of Ca on hypertension. In our study, we confirmed that hypertension and type 2 diabetes were two possible mediators of the association between Ca and stroke. Notably, none of the previous studies found a non-linear association, presumably limited by the statistical power.
The discrepancy in the association of total Ca and dietary Ca intake with ischemic stroke (a threshold effect like non-linear association of total Ca and less clear pattern and borderline non-linear association for dietary Ca) may be explained by multiple factors, including sources of Ca intake and bioavailability. The absorption of Ca taken from food is affected by the source of the food, which may have Ca bound in oxalate or phytate, while Ca from supplements may be more readily absorbed [37]. Generally, about 30% of Ca from food is absorbed but the bioavailability varies by the source of Ca [38]. Mean (fractional) Ca absorption is directly proportional with intake at high intake. While Ca is mostly actively transported from the intestinal lumen, at high levels passive diffusion is involved in Ca absorption [39]. Individuals that take Ca supplements may have higher socioeconomic status and may be more health conscious as well [39,40].
Though participants with high Ca intake also tend to have high serum Ca, serum Ca is tightly regulated by parathyroid hormone and calcitonin. Parathyroid hormone maintains the level of serum Ca by increasing bone resorption, renal reabsorption, and intestinal absorption by activating vitamin D in the kidney [41]. In contrast, calcitonin reduces serum Ca by prevention of bone resorption [42]. Thus, the level of serum Ca is hormonally regulated by parathyroid hormone, vitamin D and calcitonin and is not only affected by the amount of Ca intake. In the present study, we have adjusted for vitamin D intake in the cohort analysis and in a sensitivity analysis for serum 25(OH)D in the case-cohort analysis. After adjusting for vitamin D, the association for total Ca became stronger but slightly attenuated for serum Ca. We did not have data to adjust for sex hormones but experimental studies indicate sex hormones impact cardiac contractility and Ca homeostasis [43].
The pathophysiology of ischemic stroke involves atherosclerosis that narrows arterial blood vessels supplying blood to the brain or occlusion of the blood vessels with thromboembolus originating in the heart or other blood vessels resulting in reduced blood flow to the neurons [44]. The mechanism through which Ca is related to lower risk of ischemic stroke may include reducing platelet aggregation [45], blood cholesterol [46,47], blood pressure [1,2], and the risk of type 2 diabetes [48,49]. In this study, type 2 diabetes, FBG, SBP, hypertension, HDL, and total cholesterol significantly mediated the associations between Ca intake and ischemic stroke. The mediation by cholesterol was evident after adjusting for vitamin D intake. Previous studies found Ca supplementation reduced insulin resistance [50,51]. The nature of the mediation may be more complex than described in this study; for example, the effect of type 2 diabetes may be through worsening hypertension given that type 2 diabetes affects the vascular system. While increases in intracellular Ca have been implicated in ischemic injury in ischemic stroke, higher serum Ca has been reported to be associated with reduced ischemic tissue injury in ischemic stroke by affecting excitotoxic pathways and ischemic preconditioning [52]. The nonlinear association between Ca intake and the risk of ischemic stroke might be explained by the inadequacy of the protective physiologic benefits at low intake and the dominance of pathologic effects such as cerebrovascular calcifications and atherosclerosis at high intake [53]. In addition, the pattern and source of Ca intake might be different at low and high intakes. Those with inadequate Ca intake might be consuming Ca through dietary sources low in Ca while those with high total intake might be taking high levels of Ca supplements, which might increase the risk of arterial calcification. There is evidence of increased cardiovascular events with increased supplemental Ca intake, but not with increased dietary Ca intake [12].
There are some limitations relevant to the interpretation of the results of this study. First, because of the small number of hemorrhagic strokes, we could not conduct subtype analysis. Second, the study was restricted to only blacks and non-Hispanic whites, which may limit the generalizability of the results to other races. Third, we cannot rule out residual confounding, for example, by type of supplement, and sex hormones given the study is an observational study. Fourth, Ca intake and serum Ca were measured only once, and we could not account for change in dietary habits over the follow-up period. Finally, for the case-cohort analysis, serum Ca was not corrected for albumin-bound Ca, and for the cohort analysis, bioavailability for Ca intake that varies by the food sources, supplement type, and participant characteristics was not accounted for. This study also has several strengths. The prospective cohort design reduced recall bias and the long duration of follow-up with a large number of cases of ischemic stroke conferred enough power to detect clinically meaningful differences. It is unique in that we tested the non-linear association of Ca intake with the risk of ischemic stroke. Previous meta-analyses have suggested that Ca was non-linearly associated with the risk of ischemic, but to the best of our knowledge, this is the first original prospective cohort study to examine non-linear associations between Ca intake and the risk of ischemic stroke. We also conducted case-cohort analysis on the association of serum Ca with the risk of ischemic stroke to corroborate the findings from the nutrient intake with generally consistent results, which further strengthened our study. Furthermore, we confirmed the mediation of the association between total Ca intake and ischemic stroke by type 2 diabetes and hypertension.
Conclusions
In conclusion, Ca intake has a threshold effect like non-linear association with risk of ischemic stroke. Type 2 diabetes and hypertension may mediate the association. Given the growing concern on the role of Ca intake in cardiovascular and cerebrovascular health and the variable results from individual studies, larger prospective cohort studies with repeated measurements of Ca intake, and randomized controlled trials are needed to elucidate the beneficial and detrimental role of Ca intake.
Supplementary materials
Supplementary materials related to this article can be found online at https://doi.org/10.5853/jos.2019.00542.
The proportion (%) of the association between total calcium intake and ischemic stroke mediated by covariates
Restricted cubic spline of dietary calcium (Ca) intake and the hazard ratios of ischemic stroke (n=19,553). The middle solid line indicates the point estimates and the broken lines indicate the lower and upper limits of the corresponding 95% confidence intervals. The horizontal broken line is at hazard ratio=1. Four knots were used for the analysis. In the restricted cubic spline analysis, a borderline non-linear association was observed (P for non-linearity=0.053).
Restricted cubic spline of supplemental calcium (Ca) intake and the hazard ratios of ischemic stroke (n=19,553). The middle solid line indicates the point estimates and the broken lines indicate the lower and upper limits of the corresponding 95% confidence intervals. The horizontal broken line is at hazard ratio=1. Four knots were used for the analysis. In the restricted cubic spline analysis, a significant non-linear association was observed (P for non-linearity=0.034)
Notes
Disclosure
The authors have no financial conflicts of interest.
Acknowledgements
This work was supported by a research grant from the NIH (R01ES021735). REGARDS is supported by a cooperative agreement U01 NS041588 from the National Institute of Neurological Disorders and Stroke, National Institutes of Health, Department of Health and Human Service. The content is solely the responsibility of the authors and does not necessarily represent the official views of the National Institute of Neurological Disorders and Stroke or the National Institutes of Health. Representatives of the funding agency have been involved in the review of the manuscript but not directly involved in the collection, management, analysis or interpretation of the data. The authors thank the other investigators, the staff, and the participants of the REGARDS study for their valuable contributions. A full list of participating REGARDS investigators and institutions can be found at http://www.regardsstudy.org.